The equity markets rallied to the top of the trading range last week carrying the Dow Jones Industrials and S&P 500 to a stones-throw from all-time record highs. Stocks were supported by better-than-expected first-quarter earnings, improved economic data from China and continued technical improvement in the broad market.
Although the popular stock market averages are positive on the year, the fact is that stocks have made little progress since the fourth quarter of 2014. This is due primarily to the lack of profit growth the past 30 months that resulted in inflated valuations.
First-quarter earnings are anticipated to be down 8.00%, but this could mark a trough in earnings given that commodity prices are firming and the uptrend in the U.S. dollar has been broken. As a result, the headwind that caused stocks to stall in 2015 and 2016 could now become a tailwind in the second half of the year. The risk is that the economy slows and profit growth fails to materialize. The odds of this are considered unlikely given the strength in the labor markets and monetary accommodation from the world’s central banks.
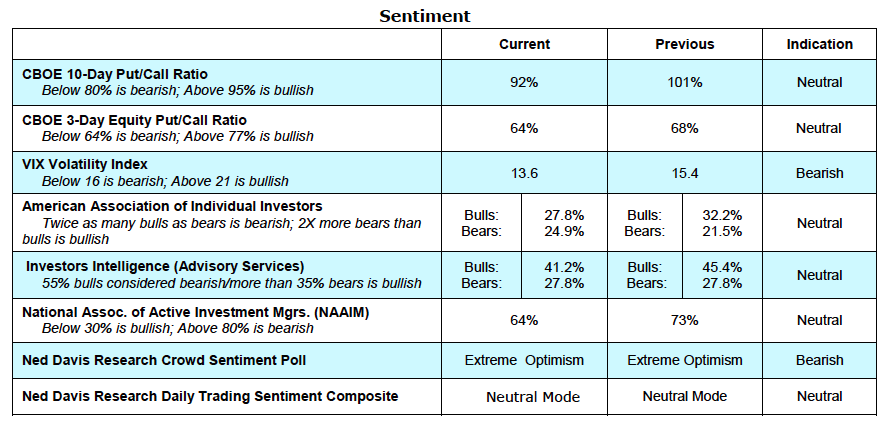
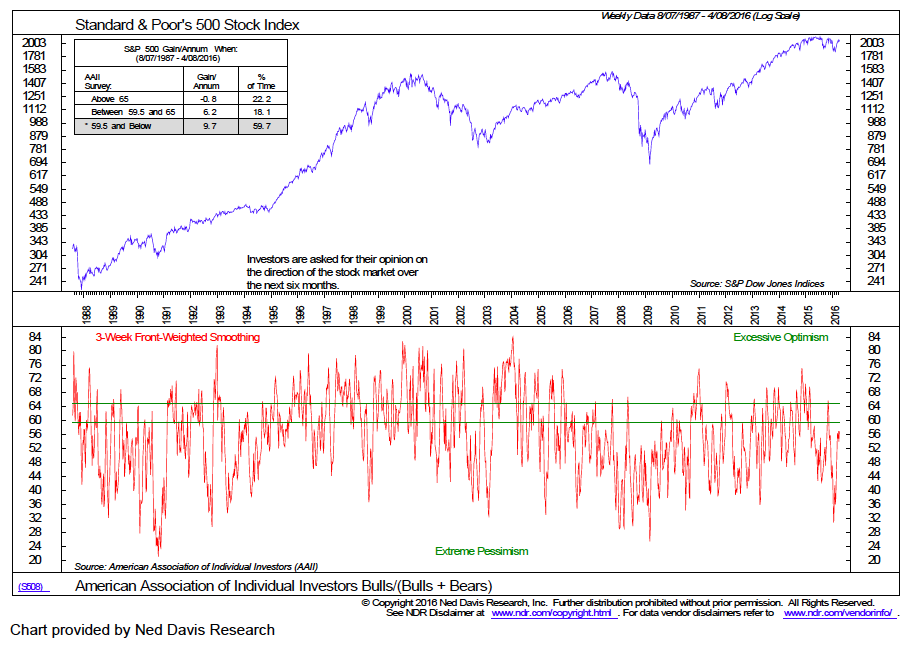
Near term, stocks are likely to test the 2100 resistance area using the S&P 500. This is based on results from the latest investor sentiment indicators and the fact that the rally since the February lows has been accompanied by broad market participation. It is unusual that investor sentiment remains cautious following a rally that has stocks sitting at the highs for the year. Typically, the top of the market coincides with a peak in investor optimism. This is readily seen in the latest reports from Investors Intelligence (II), the American Association of Individual Investors (AAII) and the National Association of Active Money Managers (NAAIM), all of which show a reduction in the size of the bullish camps. We would become concerned should the II data show 55% or more bulls, the AAII numbers show 2.5X as many bulls than bears and/or the NAAIM survey show money managers’ asset allocation to stocks at 80% or more.
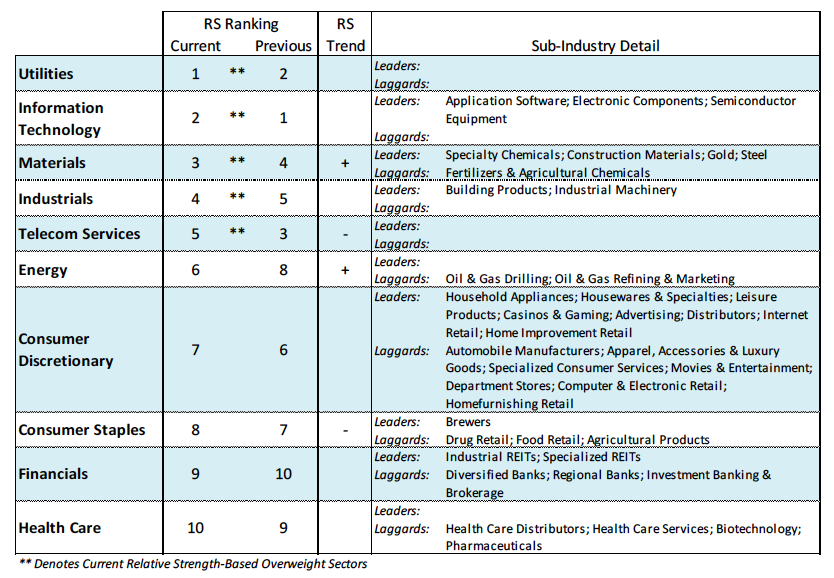
Looking further out, the prospects for the popular stock market averages to attack the 2015 record highs for the Dow Jones Industrials (18137) and the S&P 500 (2132) are supported by the fact that the broad market continues to exhibit considerable strength. Evidence of this is found in the fact that the New York Stock Exchange (NYSE) advance/decline line hit a new all-time record high last week. In addition, the percentage of industry groups within the S&P 500 that are in defined uptrends climbed to 63% last week from 12% in mid-February. A move above 65% historically has been considered a bullish long-term signal.
Thanks for reading.
Further Reading: Weekly Stock Market Outlook: 3 Emerging Themes
Twitter: @WillieDelwiche
Any opinions expressed herein are solely those of the author, and do not in any way represent the views or opinions of any other person or entity.


