As of this writing, we do not yet know the outcome of the Brexit vote. Even so, we expect the event to jostle the British Pound into one of two possible Elliott wave scenarios. Whichever path the British Pound takes, it should produce good trade openings over the coming months.
In this post, we examine the two most likely British Pound Elliott wave paths using the CurrencyShares British Pound Sterling Trust (symbol FXB).
We don’t expect the next move in the British Pound ETF (FXB) to be drastic in either direction. Viewing the larger British Pound Elliott wave pattern as corrective since 2007, the most drastic part of the adjustment took place several years ago in wave ‘A’. Price is only now revisiting that area as it proceeds through wave ‘C’. Although we think FXB can make lower lows, it should reach them in an orderly fashion.
With both of our scenarios, downward wave ‘C’ should consist of five waves. If those waves overlap, then wave ‘C’ will form an ending diagonal pattern that could afford to produce at least one more lower low for the British Pound. This scenario is shown on the chart below using black wave labels and a black line showing a likely price path. If this scenario is in effect, then price is probably working on wave [iv] of the diagonal now. And it might test the resistance area near 148.21 to 151.23 before reversing in wave [v] – the final move in the diagonal.
Although we cannot be certain, the British Pound Elliott wave scenario with the ending diagonal ‘C’ wave might correspond to a vote by the United Kingdom to stay in the European Union. That decision might produce a short-lived boost in the value of the Pound.
British Pound Elliott Wave Chart – $FXB (2 scenarios)
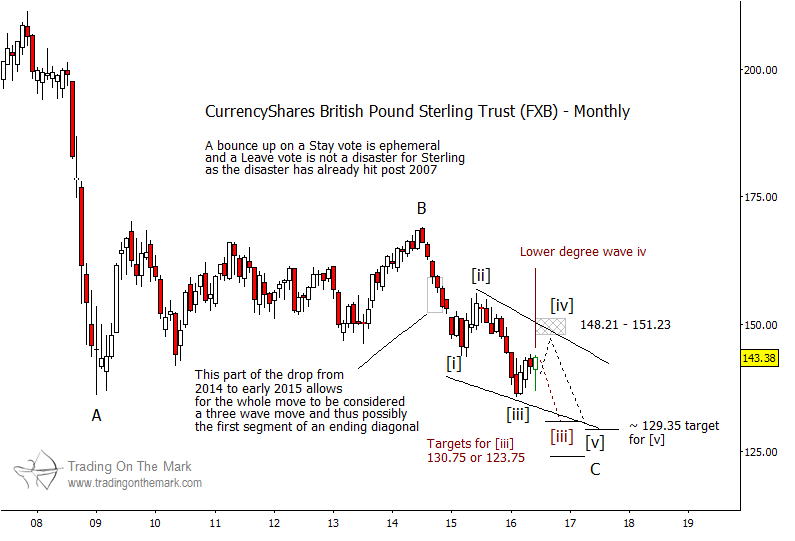
On the other hand, FXB might be tracing downward wave ‘C’ in an impulsive five-wave move instead of an overlapping diagonal one. If that is the case, then the middle wave [iii] of the sequence can probably reach lower before a fourth wave consolidation begins. This scenario is shown using red labels and a red price path. A possible support area to mark the bottom of wave [iii] is near 123.75 to 130.75, and wave [v] would eventually take price even lower.
More From Tom & Kurt: Outlook For US Treasury Bonds Still Bearish
We might imagine the downward impulsive scenario corresponding to a vote by the U.K. to leave the E.U. Some confirmation of this scenario might come from price moving sharply lower after the vote. If price forms a new, lower low in coming months, then any subsequent bounce in wave [iv] should stay beneath 143.59, which is the bottom of wave [i].
Note that you can keep up with posts and articles from Trading On The Mark by following us on Twitter (link below) and Facebook!
Thanks for reading.
Twitter: @TradingOnMark
No position in any of the mentioned securities at the time of publication. Any opinions expressed herein are solely those of the author, and do not in any way represent the views or opinions of any other person or entity.


