 Heading into the holiday weekend, it was clear that this week would produce some interesting price movement on the major indices and across select asset classes (i.e. commodities). The markets were ripe with technical chart setups: the S&P 500 was on the verge of breaking out, the Russell 2000 was trying to break its downtrend line, Emerging Markets (EEM) were pushing into key multi-year resistance, Gold (GLD) was coiled in a tight triangle, and the VIX was getting destroyed. Is that all?
And returning from the holiday has highlighted some key breakouts and breakdowns. From an active investing standpoint, it’s important to understand what to watch for over the coming days. Below are some charts highlighting some key price moves and potential chart setups to monitor.
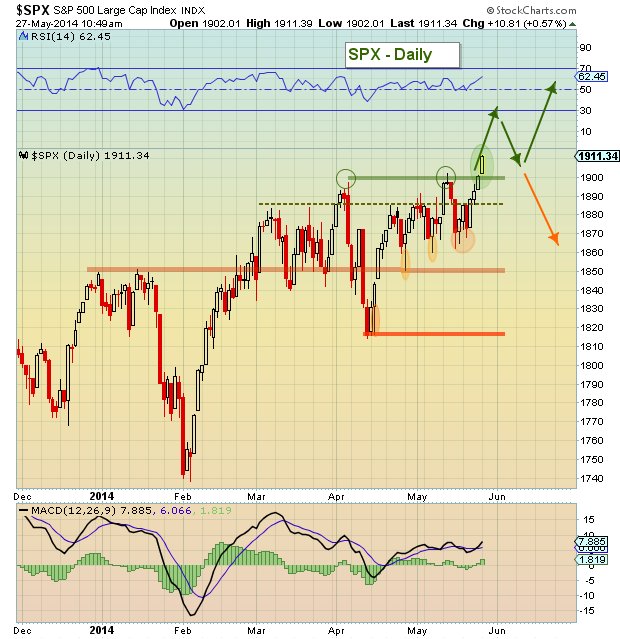
Let’s start with the S&P 500. The breakout over 1900 looks good so far. A continuation move into Thursday or Friday would be strong for bulls. It would also setup a potential re-test of the breakout on a pullback that could be bought with a tight stop later this week or early next week. I mention tight stop, because if a breakout fails, well, you know, it’s not pretty.
S&P 500 (SPX) Daily Chart
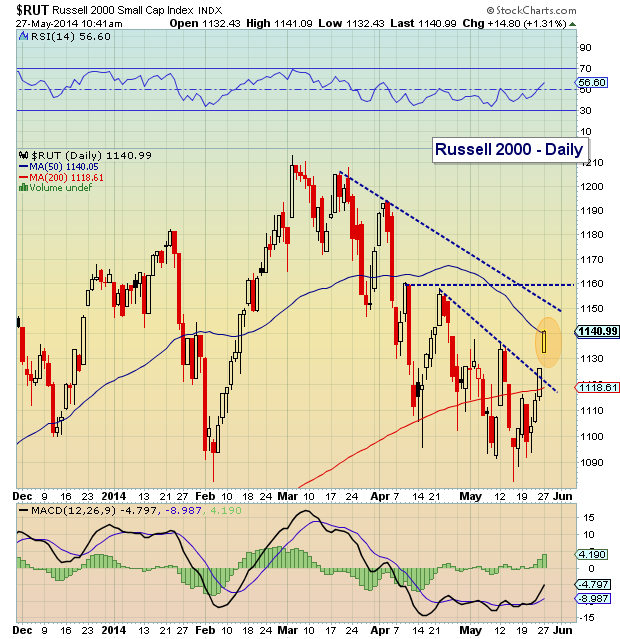
The Russell 2000 has been especially strong of late, burning shorts with a big move higher. However, it’s worth noting that the 50 day moving average is still declining and needs to flatten out. As well, the RUT is still healing some structural damage. A pause near 1150 or 1160 would be healthy and give the index time to consolidate.
Russell 2000 (RUT) Daily Chart
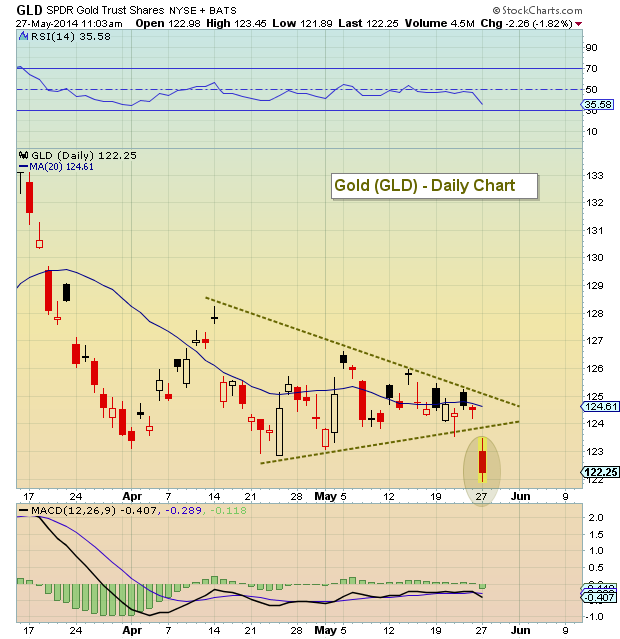
Last week, I highlighted the coiling pattern in Gold. Well, today Gold prices broke lower and that chart setup highlighted why it paid to be patient. Unless Gold has a pendulum reversal up its sleeve later today or tomorrow, then this asset is still in bottoming mode. Fear of missing the move sometimes can cloud our vision. There will always be opportunities on both sides, but awaiting confirmation is both smart and safe (for active investors).
Gold (GLD) Daily Chart
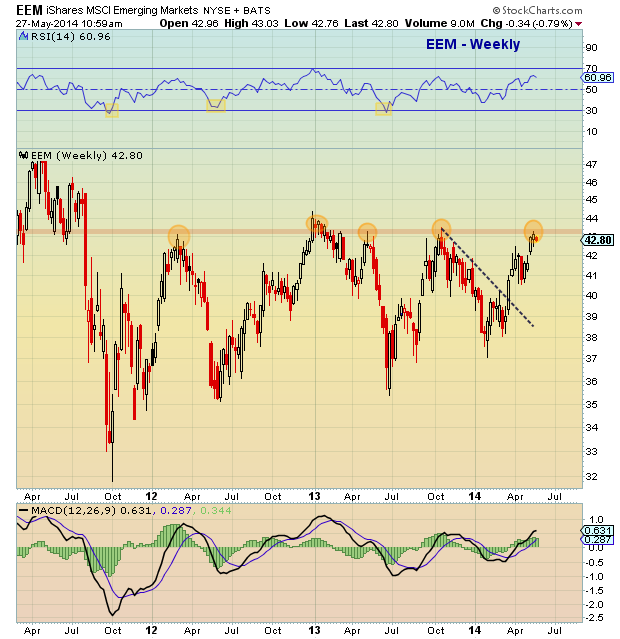
The Emerging Markets have put in a strong rally, pitting the EEM squarely against multi-year resistance. This band of resistance ($43/$44) will likely slow EEM in the near-term; this is the 5th time that EEM has pushed up against this zone in the past 3 years. That said, a clear break higher (followed by a successful retest) would likely signal a move towards $47/$48 is underway. This is one of the chart setups to keep an eye on, as the character of the price action in and around this resistance zone will dictate the next directional move.
Emerging Markets ETF (EEM) Daily Chart
Thanks for reading.
No position in any of the mentioned securities at the time of publication. Any opinions expressed herein are solely those of the author, and do not in any way represent the views or opinions of any other person or entity.


