Tony Robbins has a new book out this week called MONEY Master the Game: 7 Simple Steps to Financial Freedom. The interviews that Robbins did with some of the greatest investors of all-time (Buffett, Dalio, Tudor-Jones, Icahn, Swensen, etc.) sound like they’re worth the price of admission alone.
In a piece Robbins wrote for Yahoo Finance he discusses an all-weather strategy he developed for the book with the help of Bridgewater’s Ray Dalio. The point of Dalio’s all-weather strategy is that no one can predict what kind of economic environment we’ll see in the future so it makes sense to prepare for anything – inflation, deflation, rising economic growth or slowing economic growth.
Using the working assumption that there will be a wide range of possible outcomes and no one knows exactly what’s going to happen is an intelligent stance to take as an investor. The fact that a brilliant investor such as Dalio admits this fact tells you how hard investing truly can be (he has almost $150 billion under management).
Here’s the asset allocation that Dalio came up with for this strategy:
- 30% Stocks
- 40% Long-Term Bonds
- 15% Intermediate-Term Bonds
- 5% Gold
- 5% Commodities
And here are the relevant statistics for the 30 year period from 1984-2013 courtesy of Robbins:
- 7% annual returns
- You would have made money 86% of the time (so only four down years)
- Average loss of just 1.9%
- Worst loss was -3.9%
- Volatility was 7.6%
These numbers are impressive, so I thought it would make sense to go back a little further to see how this strategy performed in a period that didn’t include an enormous bond bull market. From 1972-2013 the annual return of was 9.5% with a volatility of 7.9%. The largest loss was -4.2%. So it held up fairly well during the 1970s too.
Going back even further is a bit of a challenge because the price of gold wasn’t allowed to fluctuate much until the early 1970s and it was nearly impossible for individuals to invest in commodities before the early 1990s. But, 85% of the portfolio is made up of stocks and bonds so we can take a look at how the majority of the portfolio performed. Keeping the same proportions in each asset class works out to a 35/65 stock/bond portfolio (47% in long-term treasuries, 18% in 10 year treasuries and 35% in the S&P 500).
Not quite the same return numbers, but not bad over the long-term:
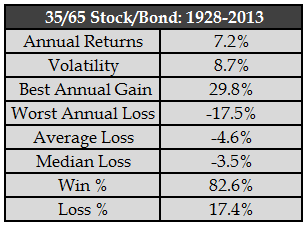
The worst annual loss was much steeper when looking back past the previous 30 years, while the win % was down slightly. But this is still an allocation that’s shown a fairly small loss record over time, which makes sense given the large weighting in bonds.
Breaking up the returns shows how much of the performance has been driven by the past 30 years of falling interest rates. From 1928-1983 the annual return was 5.8% with a standard deviation of 8.5%. From 1984-2013 the return was 9.8% per year with volatility of 8.7%. This shows how crazy the bond bull market has been over the past three decades. Investing in this same exact asset allocation earned 4% per year more in returns at roughly the same volatility profile.
This doesn’t invalidate Tony Robbins strategy. His numbers are still valid, but it would be a mistake to assume future returns in bonds will be anywhere close to what they were from 1984-2013.
And while the win ratio and average loss Robbins lays out are impressive at first glance, when you break out the asset classes individually it makes sense (click to enlarge):
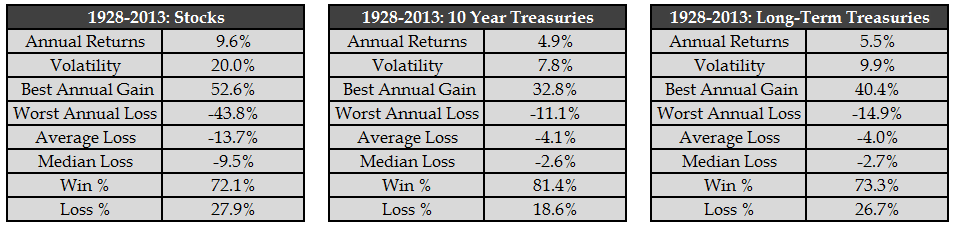
Of course a bond-heavy portfolio is going to perform better in the down years – that’s what bonds are for. They act as portfolio stabilizers during economic downturns and stock market crashes. Each one of these asset classes on its own has a pretty good winning percentage. Combining them together into a portfolio predictably lowers the volatility. That’s how diversification works.
The all-weather portfolio that Tony Robbins laid out isn’t reinventing the wheel. It’s a fairly simple, broadly diversified portfolio. Any long-term asset allocation to risk assets that is systematically rebalanced and followed through over time will show solid performance numbers. It’s the following through part that gets most investors.
If more stocks are included the expected returns and volatility should be higher, but losses should be larger as well. If more bonds are included the expected returns and volatility should be lower, with smaller losses incurred. That’s the nature of the risk-reward relationship.
Adding commodities or gold could help during a spike in inflation, but the point is that ANY diversified portfolio that is bought and held over a long enough time horizon should work out for an investor if they have the patience to see the strategy through.
Source: Tony Robbins: Ray Dalio’s “All Weather’ Portfolio (Yahoo! Finance)
Read this and more from Ben on his blog A Wealth Of Common Sense. Follow Ben on Twitter: @awealthofcs
Any opinions expressed herein are solely those of the author, and do not in any way represent the views or opinions of any other person or entity.
 Rolling Over At Key Fibonacci Level?")


