Many investors may not like to hear this, but I think the market will retreat. Why do I say this and with what guarantee?
The truth is that I have no idea of when it will happen but the probability of it happening is increasing as time prods forward. And I think it will turn soon and head back to the short side on multiple time frames (see below).
Does this mean there aren’t any opportunities on the long side and that you should stay out of the market? Absolutely not. However, eventually the stock market futures indices will close what I call the Open Daily Gaps. This would also include any open gaps on the the ETF’s that associate with the major futures indices.
Just to clarify, I am talking about regular trading hours. This is where the volume is and that is why I like to use regular trading hours (RTH) charts. The ETF is restricted to those hours and thus the picture is the similar.
So What does this look like?
Let’s do a quick comparison of the 24 hour futures chart to the RTH chart.
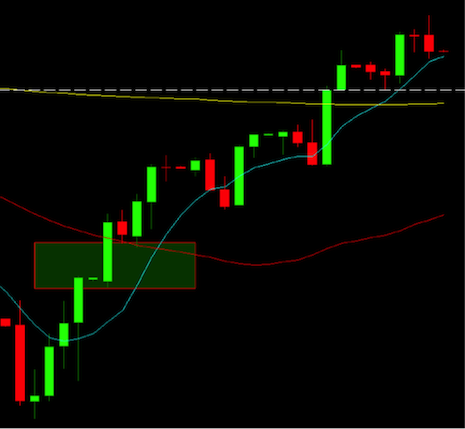
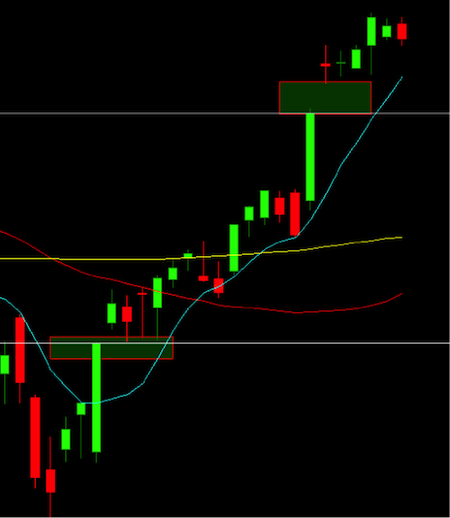
In the chart below, we have the $ES (S&P 500 e-mini) 24hr futures. Note the area that has been shaded.
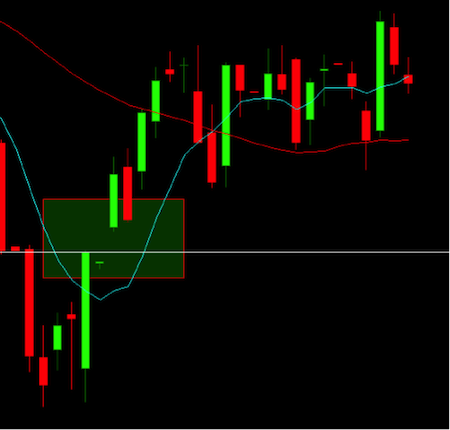
Now let’s look at the same time duration, but with a regular trading hours (RTH) chart. Note the open gap that now exists between the two sessions. Again, this is termed an open daily gap and is marked on my charts. In my opinion, open gaps like this one will eventually be closed.
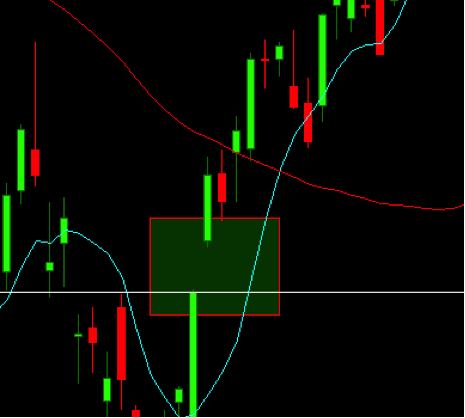
As stated above, I keep my charts set to RTH as I believe that this is where the majority of the volume sits on any given day. And the open daily gaps assist with my risk management.
Does this work just on futures or can it be applied to the corresponding SPY ETF?
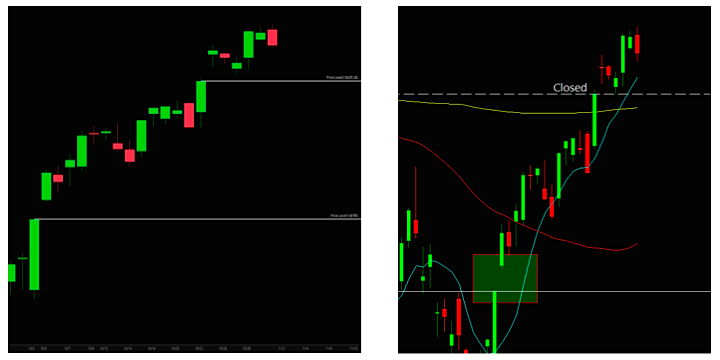
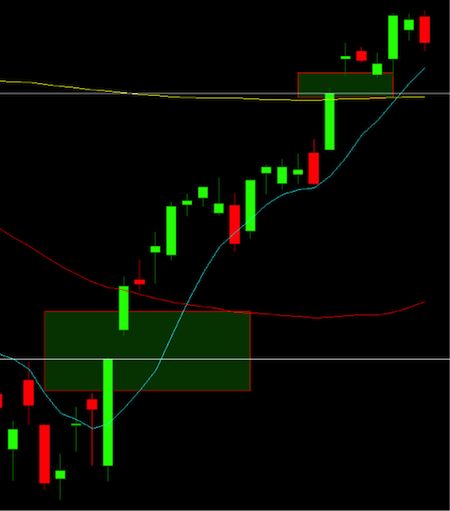
As seen below, side by side, the S&P 500 ETF (SPY) on the left and ES futures contract on the right, both have existing open gaps below. Note that they both closed out the top gap. I believe that the market will eventually retreat and close out the open gaps on both indices/charts.
Now there are articles and naysayers that will say, not ALL daily gaps get closed. I would even agree with that. However I stand firm and can guarantee that price action will retreat and close out, what I frequently call, downside business or as know here; the open daily gap on the indices futures market.
So as promised, some numbers.
ES – S&P 500 Futures: 1943 / SPY: 205.25; 195
NQ – Nasdaq Futures: 4552; 4262.5 / QQQ: 109.71; 104.1
TF – Russell 2000 Futures: 1113.5 / IWM: 110.63
YM – Dow Jones Futures: 17401; 16379 / DIA: 174.8; 164.58
What is the likelihood and at which point may these open gaps be closed?
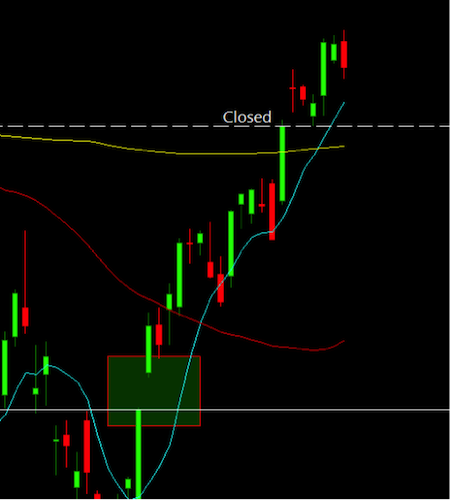
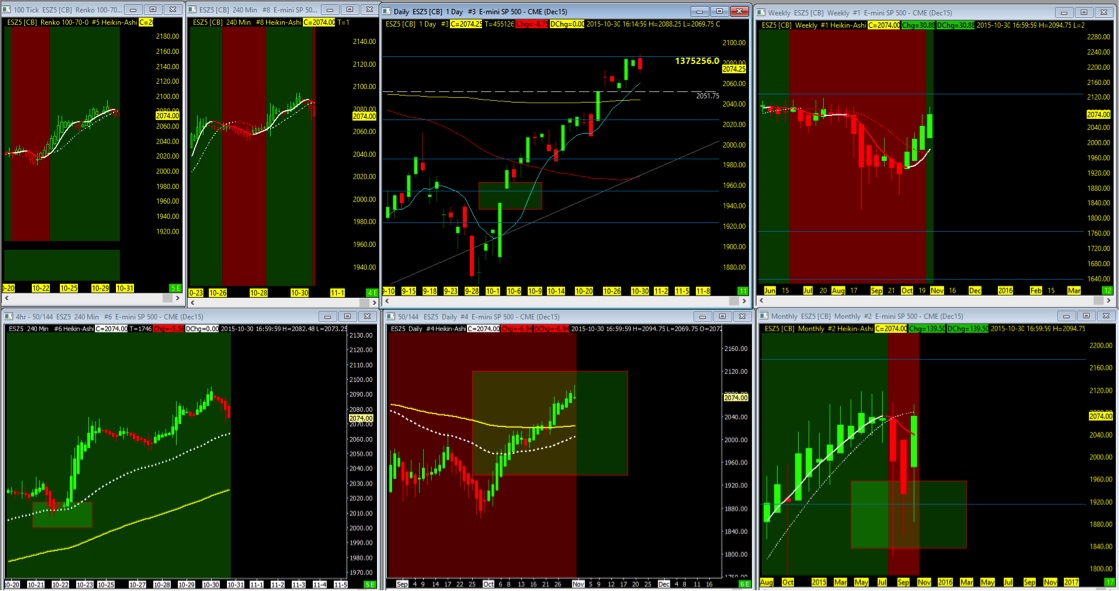
At the end of each week, I wrap it up with a weekly recap and probability factor of where price action may lead over the coming week. Based on a bit longer-term charts (see below), I access probabilities. Adding in the intraday charts can either increase or decrease these percentages. When bias forms to the downside, percentages above 75% in the RED will be a good indicator that we are headed to close the gaps.
You can find my videos posted weekly on my Website or YouTube channel. That is it. No deep explanation. It’s a simple as…ALL futures indices daily open gaps eventually get filled.
Thanks for reading.
Twitter: @TradingFibz
The author trades these indices intraday and may have a position in the mentioned securities at the time of publication. Any opinions expressed herein are solely those of the author, and do not in any way represent the views or opinions of any other person or entity.


 Ready To Break Out?")


 Rolling Over At Key Fibonacci Level?")
 Ready To Break Out?")