In the latest reporting period using numbers from the SPDR S&P 500 ETF (SPY), stock market shorts stayed put. In fact, at 280.4 million, short interest fell a tad period-over-period – now at a two-month low (see the chart below). In my opinion, the odds favor that stock market shorts are about to get more active. Take a look at the action on SPY:
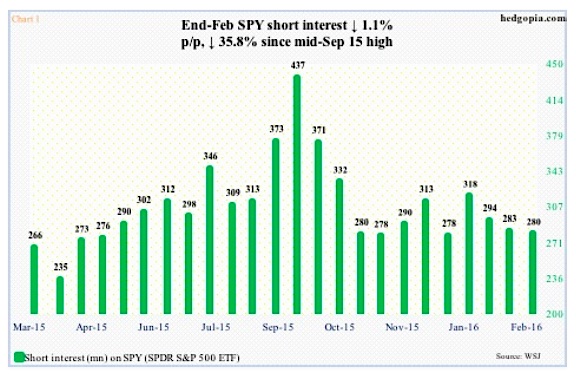
In the Feb 12-29 period, the ETF rallied 3.7 percent. Short interest fell 1.1 p/p. This was a period during which on February 11th SPY successfully retested the January 20th low before rallying hard. This probably caused some level of squeeze with shorts.
This was also a period in which SPY had a false breakout on February 26th (arrow in chart 2). During the last two sessions of February, the ETF fell one percent. Stock market shorts probably got emboldened by this. But at the same time they were not aggressively adding.
Fast forward to now, and they probably have a different mindset.
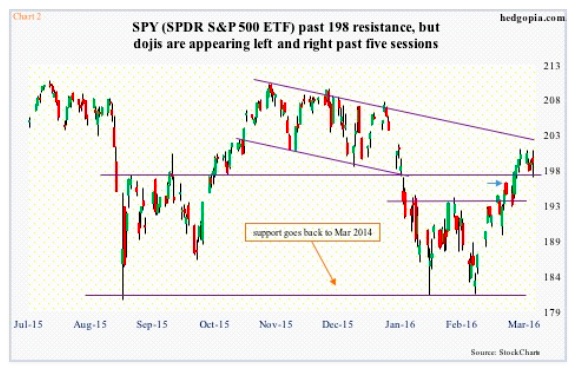
The S&P 500 ETF broke out on March 1st, and proceeded toward another resistance right above, at $198-ish, which it broke out of – although feebly. The ETF is holding above that resistance. That said, this contrasts with the S&P 500 index (1989.57), where the corresponding resistance lies at 1990, which it broke out of but only to give it back later.
Regardless, if these shorts were waiting to see if a breakout would occur and if that would entice fresh funds, the latter has yet to happen.
SPY tried to rally past its 200-day moving average five sessions ago, and it is still trying, with two back-to-back dojis. Fatigue is setting in.
Put it all together, the odds of SPY short interest rising near-term are rising.
First, if the ETF managed to rally two percent from here, it would have hit the descending November 2015 trend line (Chart 2), where resistance is massive.
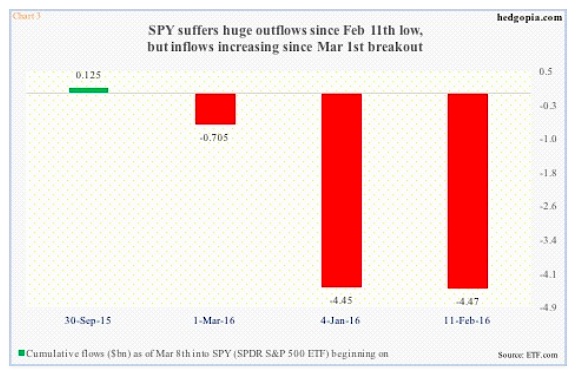
Second, Neither the February 11th low nor the March 1st breakout, or the subsequent breakout, for that matter, has enticed inflows. The four dates in Chart 3 are important in their own right. They all have some meaning.
September 30, 2015: Important low post-August/September sell-off last year
Jan 4, 2016: Important as stocks sold off as soon as the year began
Feb 11, 2016: Successful retest of January 20th low, before rallying hard
March 1, 2016: SPY breaks out (Chart 2)
The ETF has seen inflows in only one of the four, with the remaining three seeing redemptions (Chart 3). Most notably, nearly $4.5 billion has been withdrawn since the February 11th low. That said, bleeding has been significantly reduced since the March 1st breakout.
All in all, considering the overbought conditions SPY is in, and that the couple of breakouts failed to attract inflows, this probably will be viewed as a good time to be adding SPY shorts.
When on March 24th the Feb 29-Mar 15 period is reported, we would probably learn that is exactly how things evolved.
Thanks for reading!
Further reading from Paban: “January Margin Debt Numbers: Bad News For Stocks?”
Twitter: @hedgopia
Read more from Paban on his blog.
Any opinions expressed herein are solely those of the author, and do not in any way represent the views or opinions of any other person or entity.
 Rolling Over At Key Fibonacci Level?")


 Rolling Over At Key Fibonacci Level?")


