- April US Existing Home Sales soften M/M
- Price Only Five Percent Away From July 2006 Peak
US existing home sales fall 3.3 percent to a seasonally adjusted annual rate of 5.04 million in April. March, however, was revised higher to 5.21 million from the previous 5.19 million. Depending on how one looks at it, there is both good and bad in the April numbers. Year-over-year, sales have now increased for seven consecutive months. April was up 6.1 percent y/y. Nonetheless, sales have now gone sideways for nearly two years now (see chart below).
US Existing Home Sales

The primary culprit is the price.
Sales are obviously nowhere near bubble highs, but price has seen quite a recovery. The former peaked at a seasonally adjusted annual rate of 7.26 million units in September 2005. The median price peaked at $230,400 in July 2006. Last June, it rose to $222,000. April was $219,400, up 4.1 percent from March (see chart below). This January, the median price dropped to $197,600, and sales were 4.82 million then.
US Existing Home Sales – Median Price
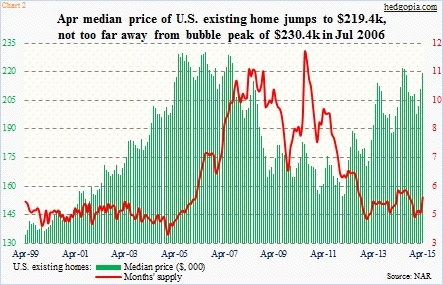
So price matters.
In the first chart above (chart 1), the red line represents a ratio of the median price to disposable personal income. Since February 2012, it has been rising. The median price was $155,600 back then, and disposable personal income $38,893. In March, disposable personal income stood at $41,513 (April numbers are not out yet). Price is sprinting, income only jogging.
The ratio can rise as (1) price rises faster, and/or (2) disposable personal income drops faster. As things stand now, the former is doing all the heavy lifting. And this has the potential to price out many potential buyers. The percent share of first-time buyers in April was unchanged at 30 percent month-over-month. Last year, this group comprised 29 percent. Historically, this is very low.
The consolation in all this is that supply is tight. At less than five months – 5.3 in April, but has risen from 4.4 last December (see chart 2). And this likely helps push up the price.
Follow Paban On Twitter: @Hedgopia
Any opinions expressed herein are solely those of the author, and do not in any way represent the views or opinions of any other person or entity.


")