 By Andrew Nyquist It doesn’t take long for investors to understand that irrational can remain irrational for longer than most think. So just as Apple (AAPL) stock sentiment was soaring on the way up, it is now sinking on the way down. Sure, this can be a sign that a bottom is nearing, but don’t kid yourself: price, and price alone, will be the final arbiter. And right now, the price action is still quite uncertain. This conundrum leaves Apple stock firmly in “prove it” territory, especially for longer term investors. For more on this, see my previous column on AAPL Key Price Levels to Watch.
This is where technical analysis and risk management comes into play. You don’t have to be a purist technician, nor “perfect” to learn how to cut/save losses and/or build positions at lower prices; in fact, I believe that technical analysis should be used in concert with fundamental analysis to develop risk management plans and theories. All it takes is some patience and a keen eye for understanding trends, indicators, and the various types of support and resistance levels. And this can be applied to most investments or stock trades, regardless of timeframe. (For more, read The Anatomy of a Trader series)
That said, and before I get too off topic, let’s look at a few annotated charts to see where Apple stock is now, and what levels are worth watching.
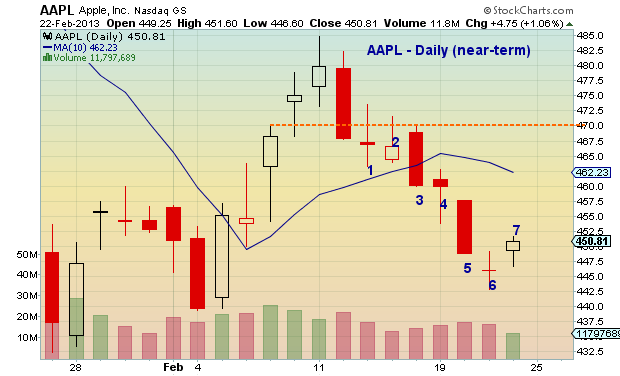
On the daily near-term chart, Apple stock is going on bar 8 of a DeMark buy setup 9 (needing a low below $442.82 to “perfect”). But more importantly, price is nearing the late January lows, a level that investors will want to keep an eye on, especially if AAPL is trying to carve out a near-term bottom. Any bounce, however, will have its share of hurdles. Very near-term resistance resides around $470. With this in mind, a break above this level would be considered constructive. This would likely bring about a re-test of the February highs. But again, let the stock “prove it.”
Zooming out a bit and looking at an intermediate term daily chart, AAPL will also have to contend with the declining trend line and 50 day moving average, both around $490-$495. A sustained break above this level would be near-term bullish. On the support side, the RSI is making higher lows, but the MACD is teetering. And as mentioned before, the stock is near its lows and hasn’t proved anything yet. In my opinion, a new position here could only be justified by an investor that got out near the highs and is looking to build a new position, or one that badly wants to build a “new” long-term position and is looking to buy an initial starter position. I say this because at the same time that I wouldn’t be shocked to see Apple stock bounce back over $500 (near-term), I also wouldn’t be surprised to see AAPL in the 300’s at some point over the next year (intermediate term).
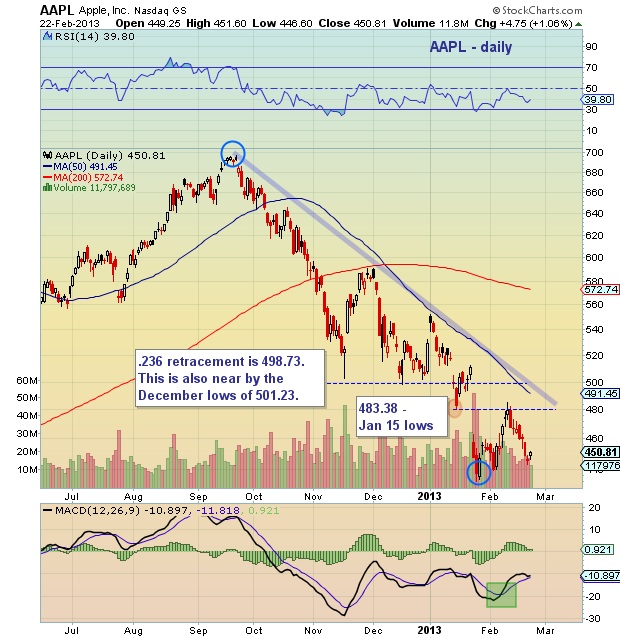
In summary, AAPL may be resigned to a “trading” stock near-term, with plays either way depending upon the setup. However, intermediate term the stock is in “prove it” mode, crowded by resistance bands at $470, $490-$495, and $510, all the while trying to make higher lows.
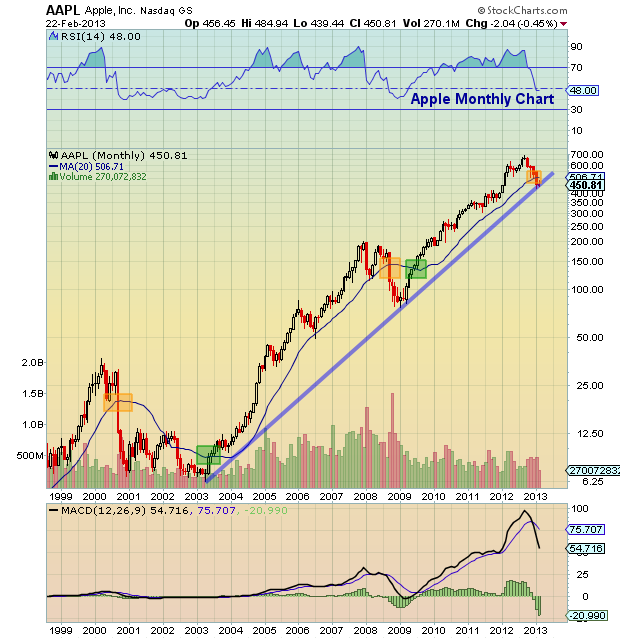
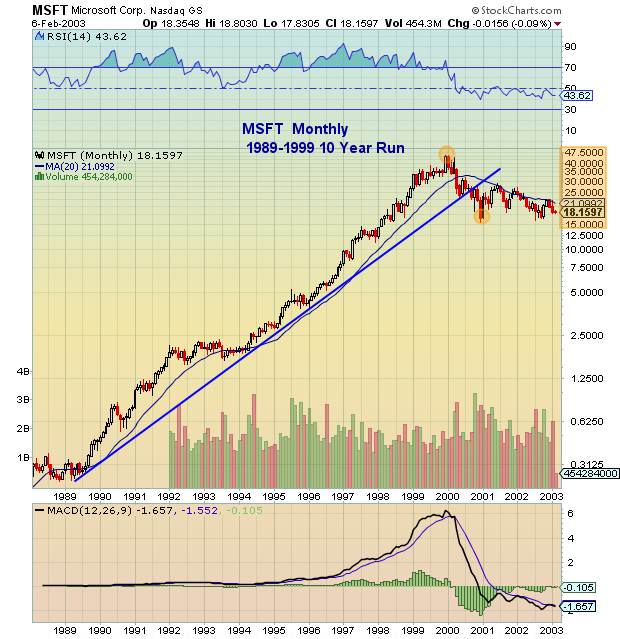
See the monthly chart below for an idea of why the 20 month moving average was/is an important “tell,” and why anything more than a quick “shakeout” below the January lows could bring the $300’s. As well, see the 10 year chart of Microsoft (MSFT) from the 1990’s to get a gauge for how long a broken trend can take to heal… different era, but eery how similar the MACD declines look.
Trade safe, trade disciplined.
Twitter: @andrewnyquist and @seeitmarket
No position in any of the mentioned securities at the time of publication.
")


