Apple (AAPL) gets a bit too much credit when its stock is near all-time highs and not nearly enough credit when its out of the limelight. But that’s more of a reactionary sentiment that revolves around a high profile name like Apple stock.
Let’s face it, Apple is a behemoth in the tech space. The trading buzz has quieted around Apple ever since its plummet from last years highs. Despite a sizable rally off its lows, Apple stock (AAPL) still sits 17 percent off its all-time highs… yet its market cap is still $604 Billion.
So I think it’s fair to say that the bulls would like to see Apple stock quietly continue higher back towards its 2015 highs.
What I want to do today is take a look at the daily, weekly, and monthly time frames on Apple and highlight why the stock is nearing a critical level here around the $110 to $115 zone… and why this may decide if Apple remains in a downtrend or begins to sow the seeds for a new uptrend.
First, let’s look at the Monthly Chart. Here, we can see that despite the big rally over the past several weeks, AAPL remains in a downtrend (until broken). The march candle closed today in impressive fashion – a big, tall, white candle with a closing near its highs. But the bulls need to see follow-through. The downtrend identifies resistance at its “highest point” around $113-$115 for the month of April. Note that the Relative Strength Index (RSI) is still in a downtrend and hovering near 50. MACD is trying to turn up.
Apple (AAPL) Monthly Stock Chart

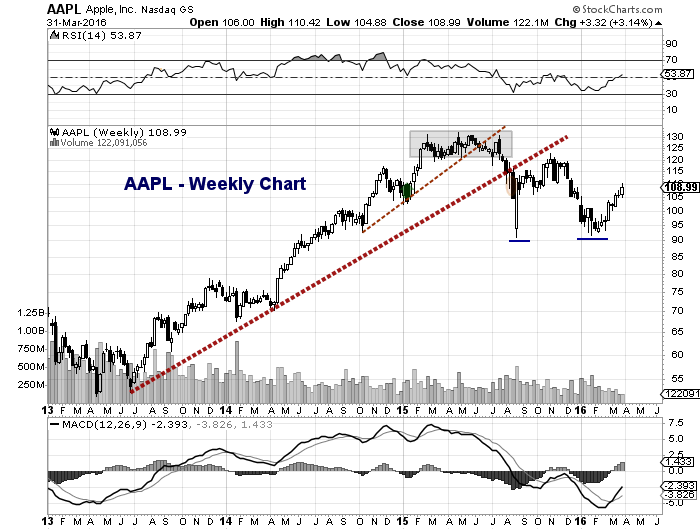
On the weekly chart, there are several observations. Note how Apple’s near-term trend breakdown last summer was a warning to the market (see thin dotted line). And after a “retest”, Apple stock collapsed through the intermediate uptrend line. That brought another “retest” and failure. BUT the stock was able to hold the August lows in February. That area (around $90) forms very strong psychological support.
The rally has pushed AAPL back to notable resistance (its December breakdown and congestion between $110 to $115). MACD turned positive in March while the RSI is sitting around 50 (similar to the monthly) – this area is no man’s land. Again, AAPL bulls need to see follow through.
Apple (AAPL) Weekly Stock Chart
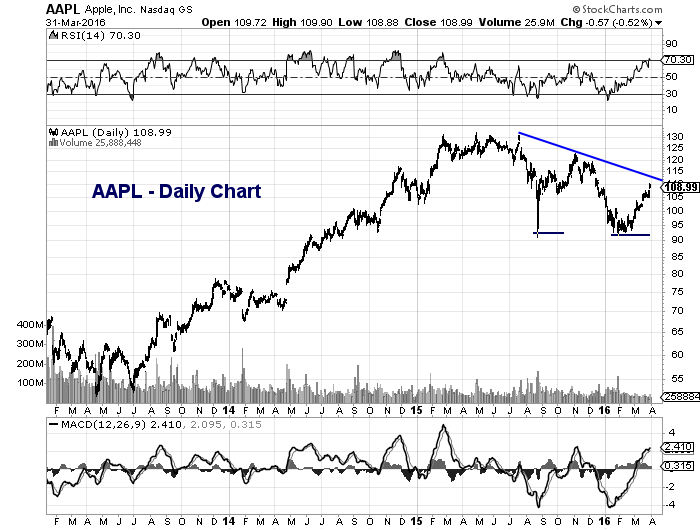
Lastly, let’s look at the daily chart. Here we see the same old down trend line that should provide resistance (at least over the near-term). RSI has pushed north of 70. This highlights a near-term overbought state BUT it also highlights a change in character. AAPL hadn’t hit 70 RSI since it was in its uptrend during 2013-2015.
Apple (AAPL) Daily Stock Chart
This is where it gets tricky for AAPL investors/traders… and why time frames and a game plan are so important. One could buy pullbacks against $90 as support. Or they could wait for a breakout and buy pullbacks from there. Or they could short into the resistance band at $110 t0 $115. No one’s knows for sure, which is why we use stops. This is about understanding time frames and discipline.
AAPL can also be used a broader market indicator. And in that regard, what happens here is important. Thanks for reading and trade safe.
Read more from Andy: “Market Tell? Watch The Treasury Bond ETF ($TLT)“
Twitter: @andrewnyquist
The author does not have a position in any mentioned securities at the time of publication. Any opinions expressed herein are solely those of the author, and do not in any way represent the views or opinions of any other person or entity.

 Rolling Over At Key Fibonacci Level?")


