When we last posted stock charts for Apple, Inc. (NASDAQ:AAPL) at the beginning of August, we showed how price action of the past two years could be the start of a larger downward-corrective pattern. Although Apple’s stock price has risen higher than we expected during the time since those charts were posted, our main price target area for the next stage of the decline is still in the range of $64 to $72.
Eventually, we believe Apple’s stock price will go even lower than that.
Elliott wave corrections are defined by overlapping moves which can point the majority of trend-seeking traders in the wrong direction. The rally for Apple’s stock (AAPL) that took place during summer and autumn has now reached the rough target area for a sub-wave inside a correction. And traders who understand the nature of corrective patterns should watch for a reversal from nearby.
Note, our earlier post had identified the April 2016 high as possibly the end of wave (b). Soon after our post was published, Apple’s stock price broke above the resistance zone we had identified for that scenario to remain valid. Now we are looking for the completion of elliott wave (b) near the current area or slightly higher.
Going forward, it is possible that AAPL could reach slightly higher to test the main boundary of the upward-sloping channel we have drawn on the monthly chart, but that test is not required. There are other types of resistance visible on a weekly chart that could initiate a turn.
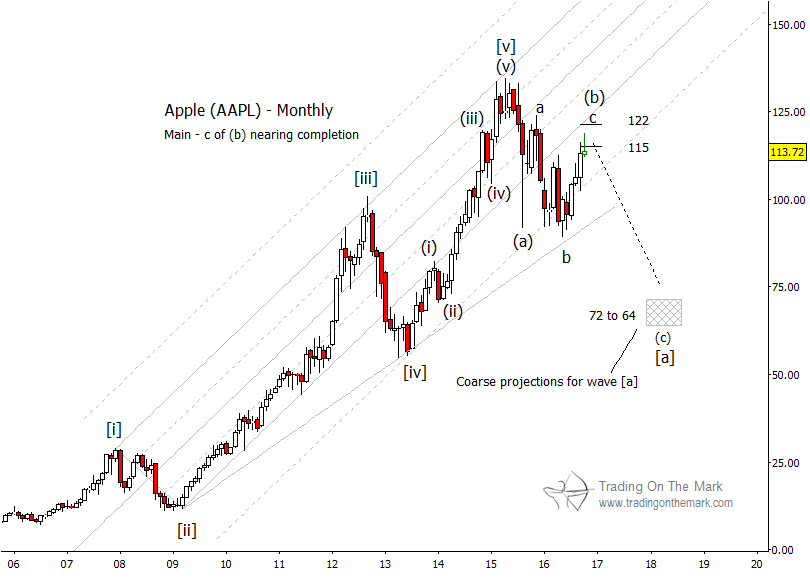
The structure of the correction is easier to see on a weekly chart. The first rapid slide from Apple’s all-time high in 2015 appears to have been wave (a) of what we expect to be a three-wave (a)-(b)-(c) pattern. Inside wave (b), a set of three sub-waves appears to have traced a time-consuming a-b-c pattern. When larger wave (b) is complete, price should fall in wave (c) to approach the target area mentioned earlier.

A downward-sloping channel on the weekly chart lends potential resistance just above Apple’s recent high. In addition, Fibonacci measurements based on the internal structure of sub-wave ‘c’ of (b) suggest possible turning points near 118.60, 120.20 and 122.90. (When there are several potential targets that are close to each other, it makes sense to think of a target zone rather than discrete levels.)
More From Tom & Kurt: Crude Oil Nearing Another Downturn
If price begins declining as we expect, then initial confirmation of our scenario would come with a weekly close beneath 112.50. Better confirmation would come with a weekly close beneath 108.40.
There’s more! Follow on Twitter and facebook to get timely market updates from Trading On The Mark!
The author does not have a position in any of the mentioned securities at the time of publication. Any opinions expressed herein are solely those of the author, and do not in any way represent the views or opinions of any other person or entity.


")
")


 Rolling Over At Key Fibonacci Level?")