The big drop in Apple’s stock price on December 1st was a near-term warning. Not only for Apple (AAPL – Quote) investors, but for the broader market. Surprisingly, the NASDAQ 100 (NDX – Quote) absorbed that down day pretty well and appeared (on the surface) as though consolidation was an easy game into the first week of December. But that consolidation gave way to deeper pullback, and AAPL led the way lower.
Apple’s stock price fell from an intraday high of $119.75 on November 25th to an intraday low of $106.26 on December 16th – that equates to an 11 percent drop. But was that enough?
On the heels of a massive 2 day market rally, AAPL finds itself nearly 6 percent above those lows. But at the same time, a wicked concoction of sentiment and volatility have investors’ heads swirling. So, let’s step back and look at some important technical support levels and indicators on the Daily and Weekly Charts.
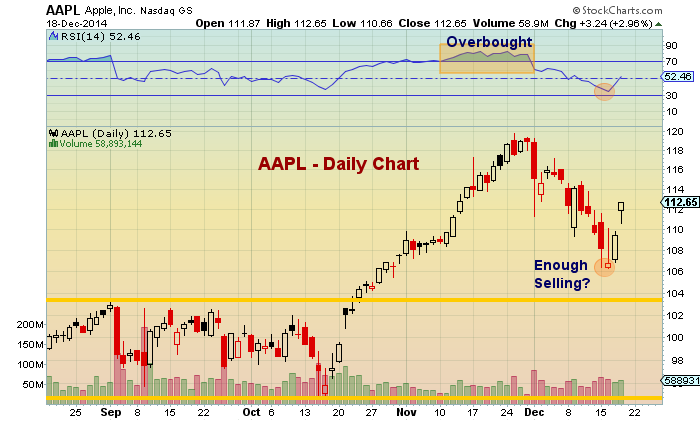
Let’s start with the daily chart (see below). As you can see, Apple shares were very overbought from about $114 on up to the late November highs at $119.75. This set up the recent pullback and drop in the daily RSI into the 30’s. The recent lows were just above the September highs and lateral support around $103.00-$104. So active investors will want to watch Tuesday’s lows ($106.26), then $103.00. A drop below the latter puts Apple into the caution zone.
Apple Stock Chart – Daily
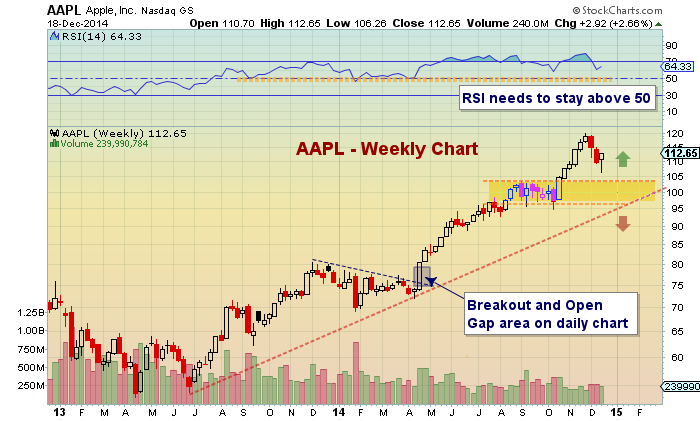
Zooming out and looking at the Weekly chart shows more of the same. Above $103 is bullish for active investors, while the $96-$103 zone would mark a return to the congestion zone (no man’s land). A move below $96 would be problematic, especially if it includes a trip below the uptrend line.
Note as well the Weekly RSI. It has held at or above 50 during the 18 month rally. RSI 50 should remain a focal point for Apple investors.
Apple Stock Chart – Weekly
Lastly, watching Apple’s relative performance to the NASDAQ 100 should also be on investors radars. As I recently pointed out, Apple has outperformed the NASDAQ 100 on a relative basis over the past several months. This has taken a hit recently, but still remains in tact.
Thanks for reading. Trade safe.
Follow Andrew on Twitter: @andrewnyquist
No position in any of the mentioned securities at the time of publication. Any opinions expressed herein are solely those of the author, and do not in any way represent the views or opinions of any other person or entity.

 Rolling Over At Key Fibonacci Level?")

 Rolling Over At Key Fibonacci Level?")


