With the recent decline to the low $90’s per share, Apple’s stock (AAPL) is back on investors radars. Some are likely underwater, while others are attempting to bottom pick.
Either way, Apple is a behemoth in the tech sector and right now many traders and investors are trying to figure out where its stock price may turn things around.
So today I decided to do some AAPL DeMark analysis. If you are not aware, DeMark is my primary choice for price analysis (check it out here). The following are my thoughts, including use of technicals and fundamentals.
You’ll find below Apple’s (AAPL) daily, weekly and monthly stock charts with my interpretation of DeMark indicators and comments on what the various levels / turns suggest; so I won’t belabor the charts. The bottom line is this:
- Getting involved in AAPL at current levels depends strictly on your timeframe and your style of legging into positions;
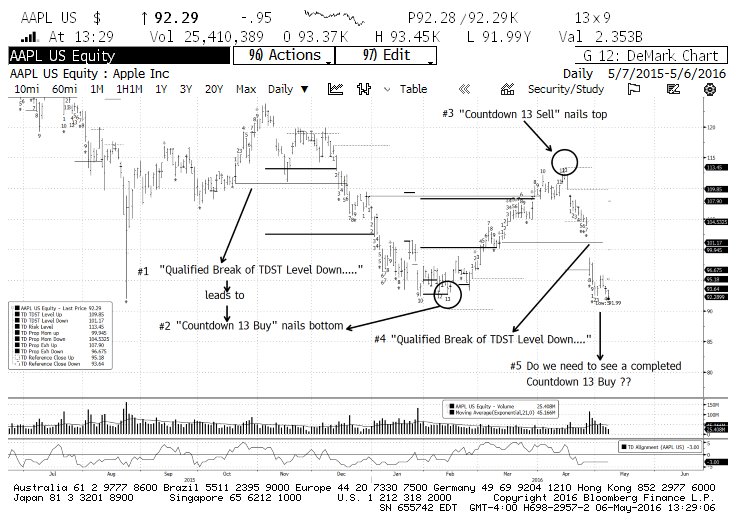
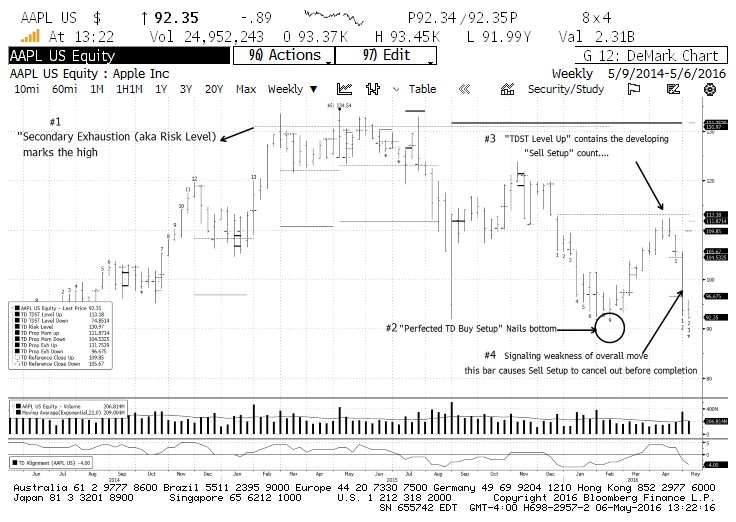
- The daily and weekly DeMark charts suggest that selling is in no way exhausted just yet; the pause the stock is seeing around $92 is probably a function of the trendline shown on the monthly chart, which everyone is focused on;
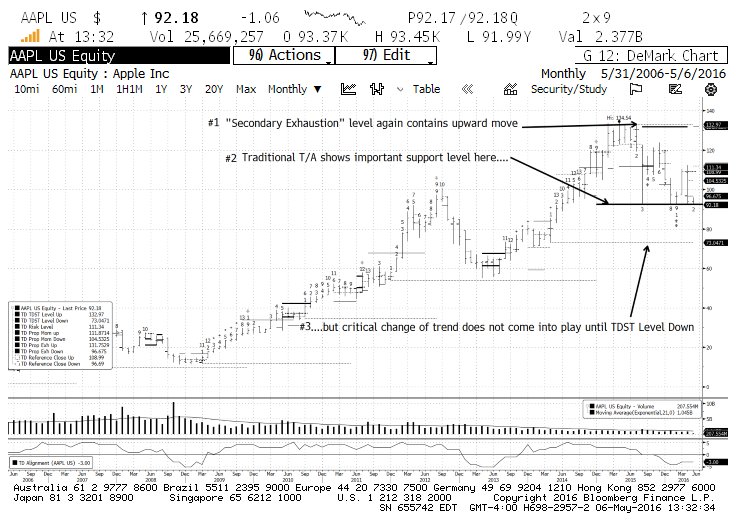
- On the other hand, the monthly stock chart shows that the upward trend for this stock remains intact.
But here’s the “elephant” in the room: DeMark tools attempt to show turning points based on buying / selling exhaustion. How is one to read those indicators in the context of a company with hundreds of billions of dollars earmarked to prop up its stock? Can the indicators reveal “selling exhaustion” when the buyer on the other side can keep on buying nearly ad infinitum? (Incidentally, there’s talk that next week AAPL will be selling another 11 figures worth of bonds to fund its capital return plan).
My sense is that AAPL stock will bleed some more from here, but the DeMark counts will be fulfilled more as a function of time than of another sharp drop. I’m legging into my long via put sales and under the assumption that downside risk is to $84.75 (Daily TD Relative Retracement target).
Apple Stock Chart – AAPL Daily
Apple Stock Chart – AAPL Weekly
Apple Stock Chart – AAPL Monthly
Good luck and good trading!
More from Fil: Akamai Prospects Looking Up As Catalysts Abound
Twitter: @FZucchi
The author has a long position in AAPL at the time of publication. Any opinions expressed herein are solely those of the author, and do not in any way represent the views or opinions of any other person or entity.
")


