 By Andrew Nyquist
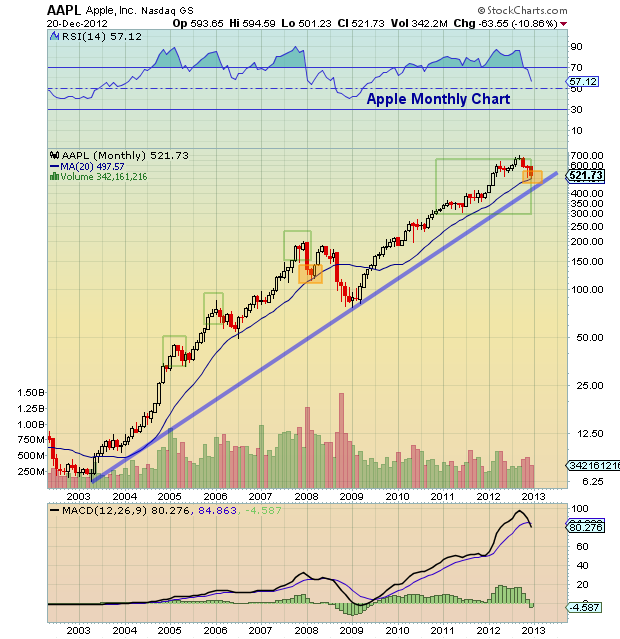
Tonight I was reviewing some select tech stock charts and found myself hung up on Apple (AAPL). Yeah, I know. It’s everyones pet project. But I was having some trouble deciphering the near-term action, so I decided to zoom OUT… a lot. I ended up with a 10-year monthly chart that, in the end, I found quite refreshing. And my brain thanked me for the relief.
Here are a couple key takeaways:
1) Apple’s recent undercut of the $500 mark touched and bounced off the 20 month moving average support. Over the past 10 years, this MA has been broken once (confirming a deeper sell off) and has been supportive twice (in 2006 and 2008). But I like the comparison to 2008 better; it held initially, producing a nice “backtest” rally, before failing and confirming the aforementioned deeper sell off. Either way, the 500 mark looks like an important toggle to watch on a closing basis.
2) The stock has room down to $425-$450 long term uptrend support. This doesn’t mean that it is magnetized to this level on immediate basis, but the trend line is there and rising… for now or later. If a break of $500 is sustained, then anything can happen. I have a rather small long position in AAPL (initiated today), but will look to add closer to $500, with the idea of catching an oversold rally that could give the stock some breathing room and put some change in my pocket.
The market is still sending mixed signals, so I am keeping positions small looking to add or cut bait as the price action dictates. Trade safe, trade disciplined.
Twitter: @andrewnyquist and @seeitmarket Facebook: See It Market
Position in AAPL at the time of publication.
Any opinions expressed herein are solely those of the author, and do not in any way represent the views or opinions of his employer or any other person or entity.


