Amazon’s stock price has been on fire in 2015. In short, Amazon ($AMZN) is an amazing company.
In fact, I used it this morning searching for “Bumble Figurines.”
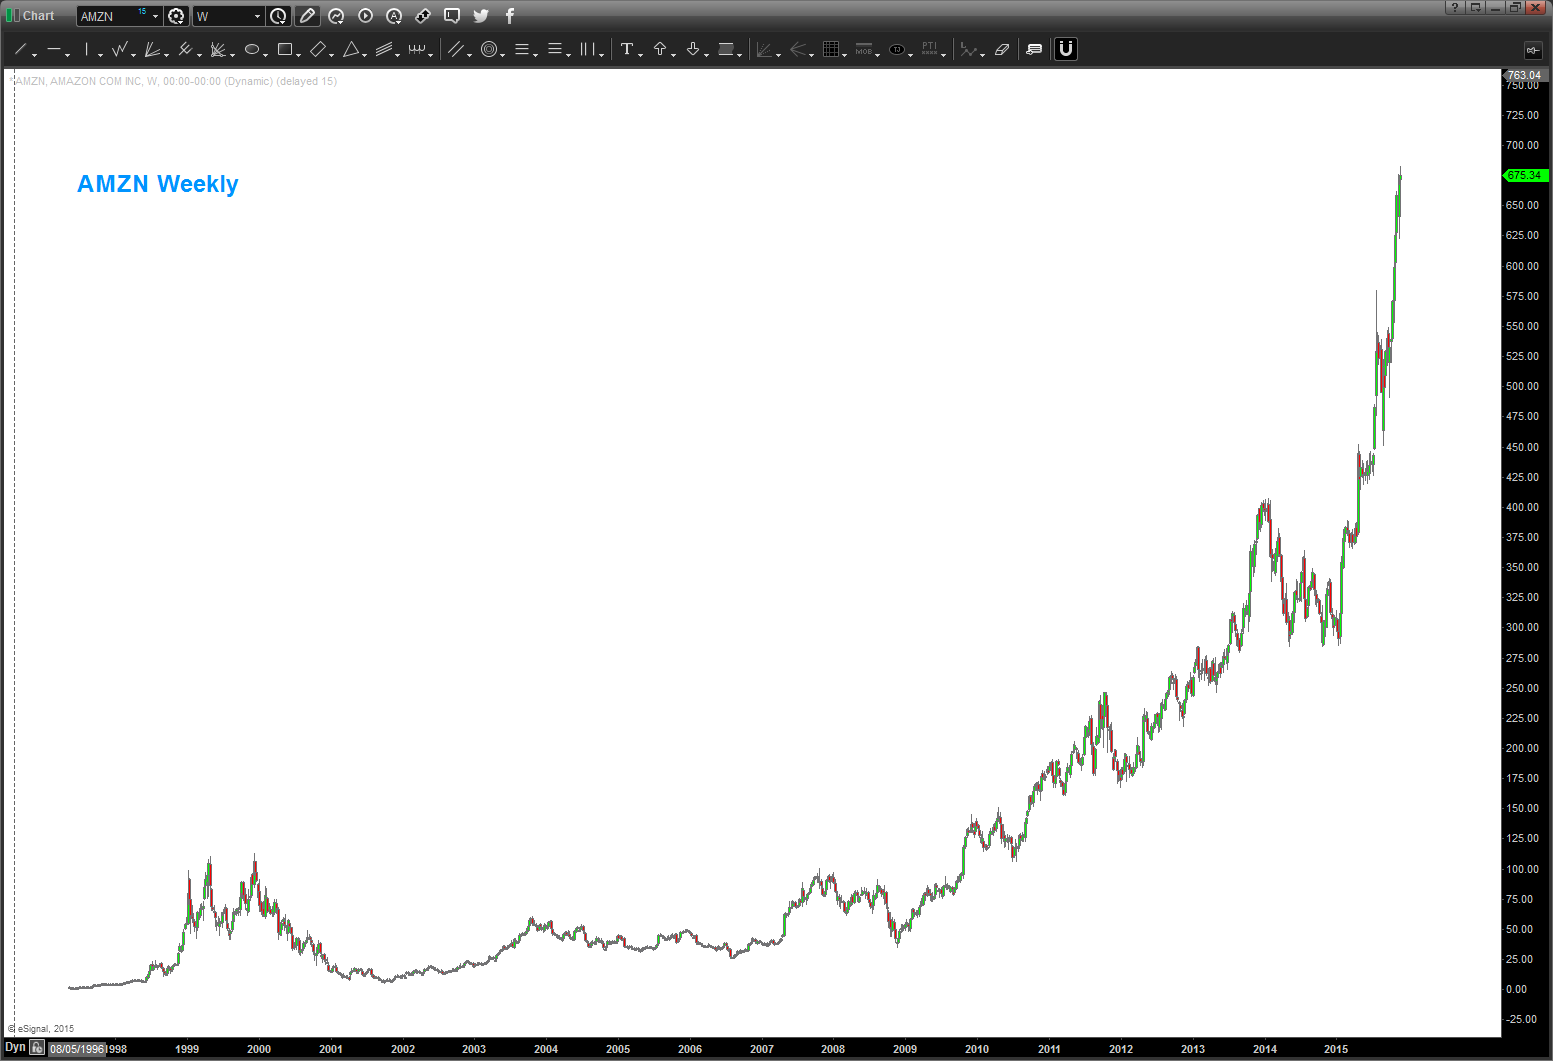
No doubt it’s been a clear winner this year (and of the past several years)… BUT when we are charting we have to remember not to follow what we believe, but rather what I see.
So what do I see? A rocket ship stock going parabolic.
And, I trust Sir Isaac Newton and gravity… in a chartist’s world, parabolic moves end up correcting swiftly and severely. (see “Is Chipotle’s Stock Chart Broken?” for an example)
So, let’s start to build the “gravity center” and see where Amazon’s stock price is simply based on geometry. If you remember back in elementary school, if you had 3 points along a line you could use them to draw a circle. That’s all we are doing in the charts below.
We can actually draw the arc that price is bouncing off of to get a feel for the “end of move” or “parabolic blow-off.” As you can see, our gravity center is off the chart at 823. Folks, that’s my first potential parabolic blow-off price target for Amazon ($AMZN). A bit of a stretch but it gives us a starting point.
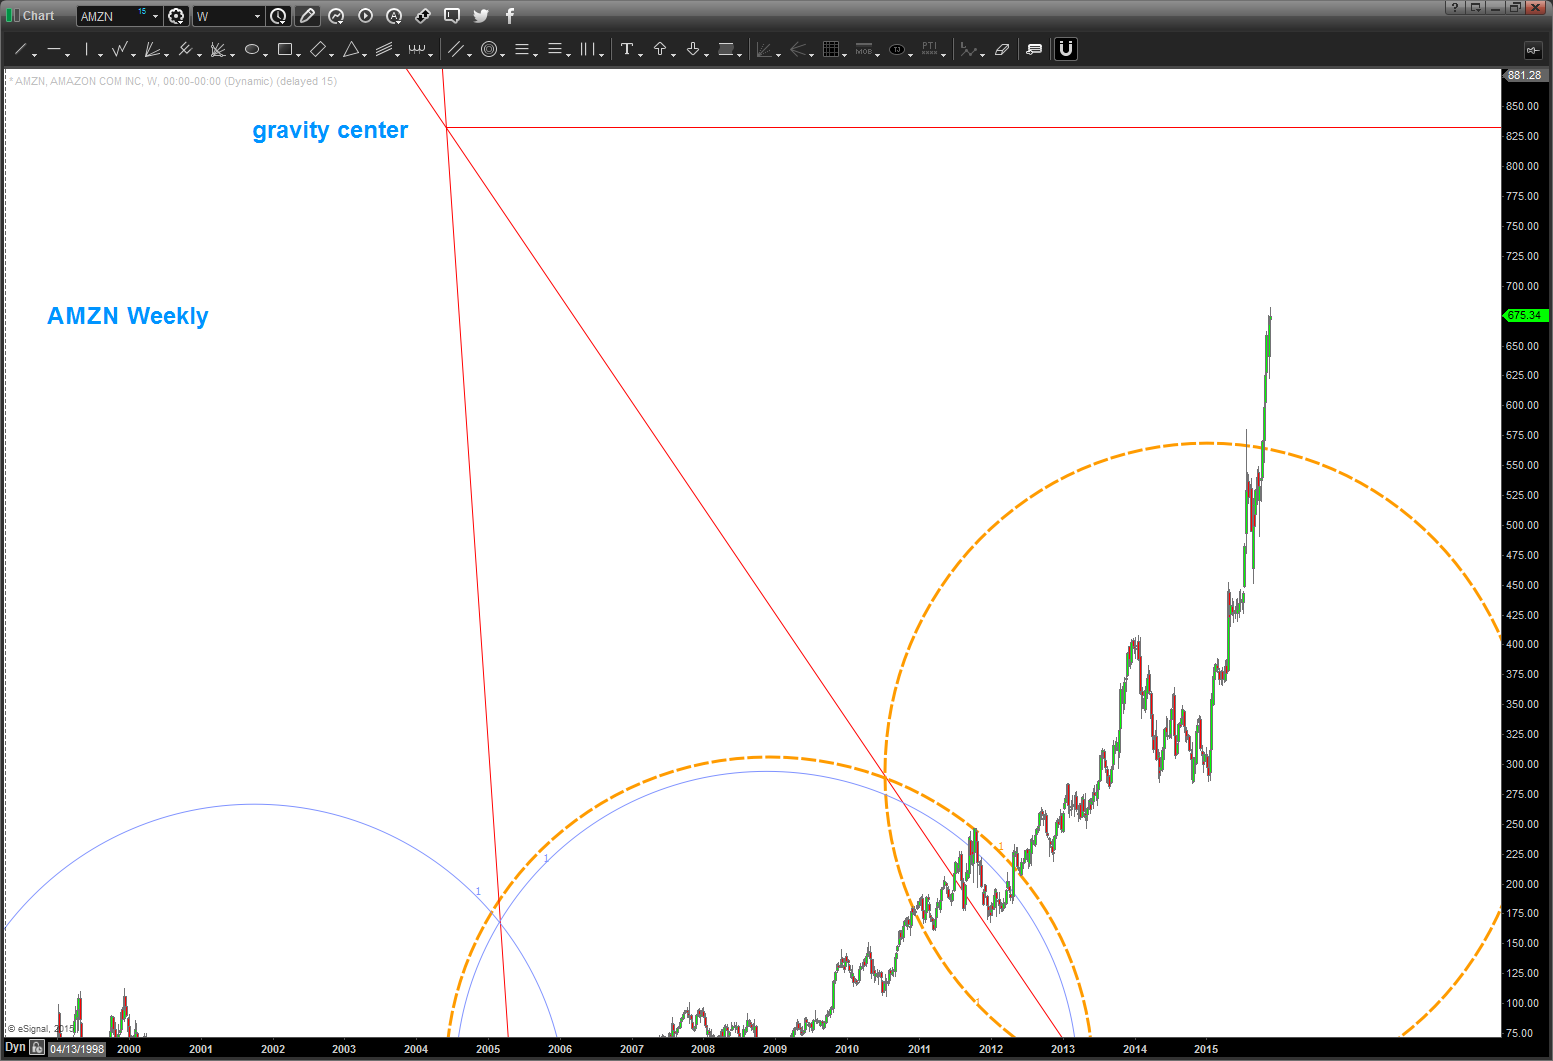
Note, for the purposes of this parabolic move, we have a good arc as you can see the effect on price when it hid the outer arc. Now, we can use “arc resistance” and with musical note ratios, Fibonacci ratios, and square roots you can bound the upper end of the arc to create a channel where price is moving. In this case we have used .886 and .786.
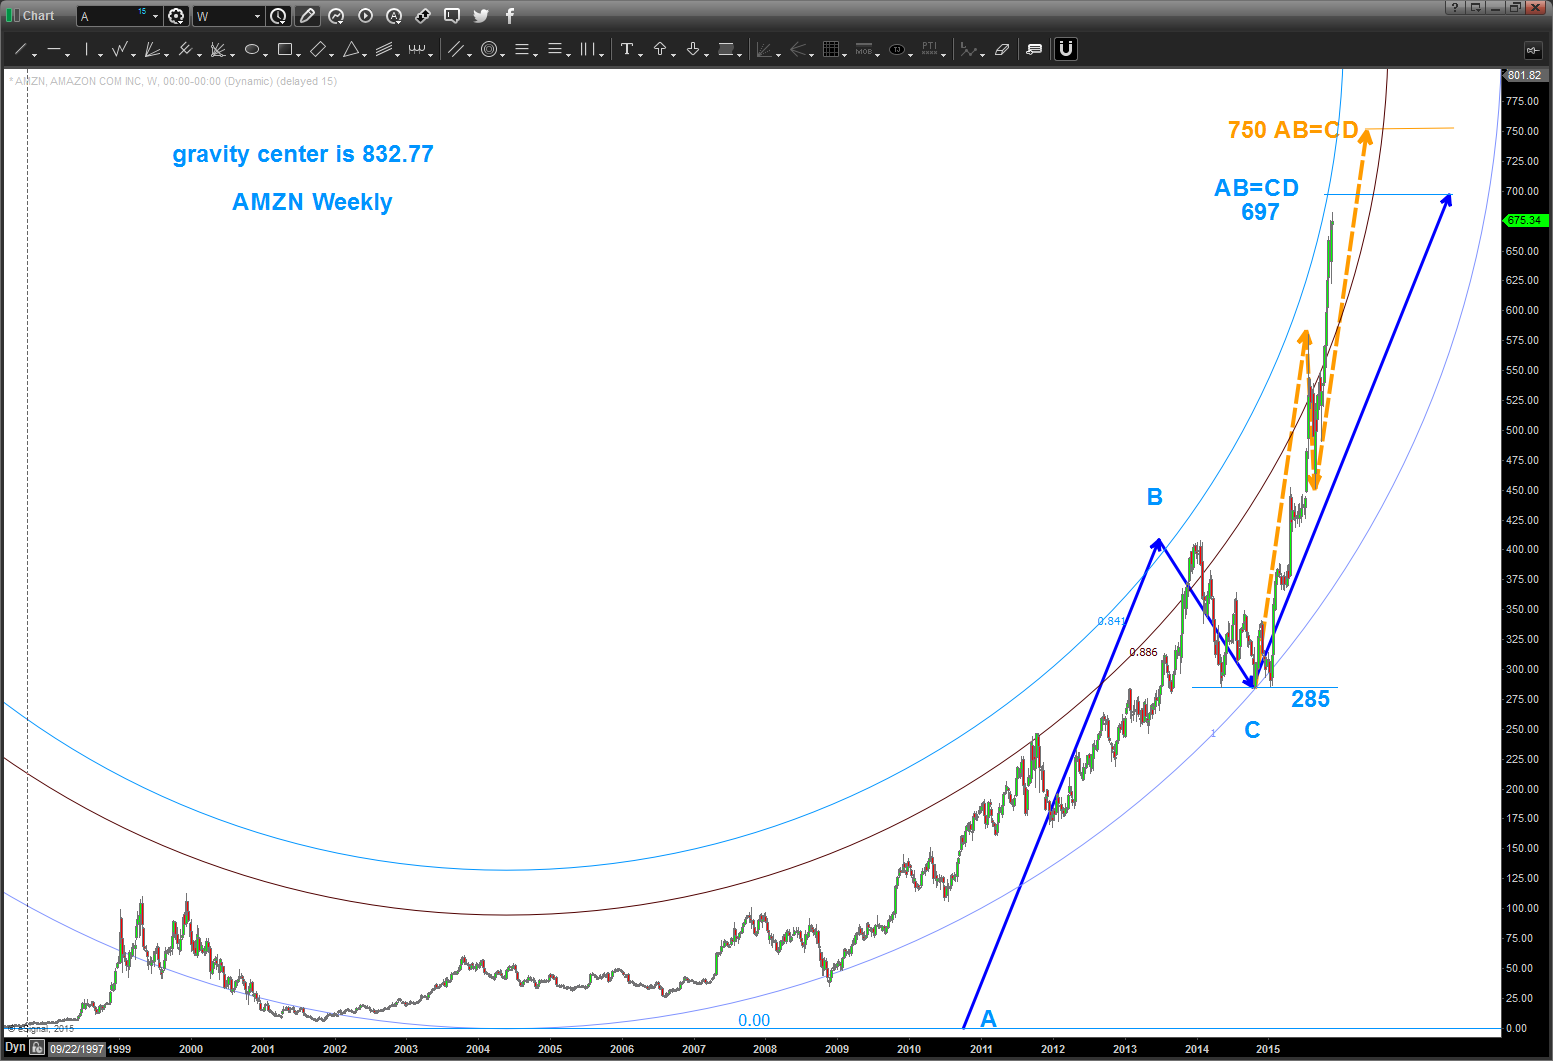
In the next chart below we use a basic, yet very powerful, measured move AB=CD (note this is not an Elliott Wave count – just a way to show the AB=CD nomenclature). That comes in just above at/around 697. Additionally, within this current move up from the 285 base, you’ll see another AB=CD (orange lines) that comes in around 750.
Now let’s look at the monthly chart for Amazon (below)… looking for divergence (not present but at an extreme overbought) and volume isn’t increasing but has been pretty steady at these levels since 2013. The fact that it’s so overbought lends credence to developing a strategy for taking profits or moving stops to a certain level for protecting profits. Not sure I would be shorting $AMZN right jut yet.
continue reading on the next page…


")
")


