The million dollar question facing investment managers that understand how elevated current equity valuations are is: How do you limit or prevent losses without constructing a portfolio comprised primarily of bonds and/or cash?
In the past we have focused on more traditional strategies to answer this question. This article focuses on an alternative asset class, agriculture. The possible transition from a record breaking El Nino to a La Nina weather pattern may be a significant variable affecting commodity prices.
Understanding this meteorological cycle change can give investors an edge in seeking unique assets with promising risk/reward scenarios.
La Nina and El Nino (The Girl and The Boy)
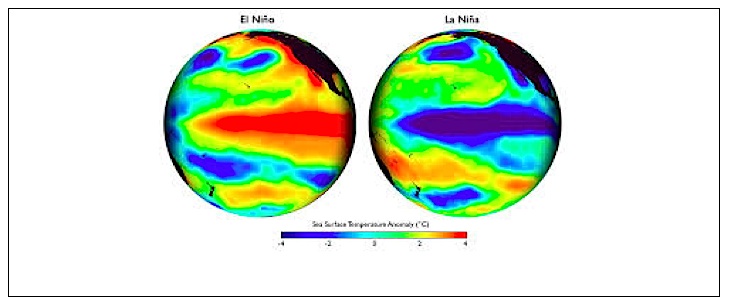
To succinctly summarize the two climatological conditions we provide a short description and visualization from the National Oceanic and Atmospheric Administration’s (NOAA):
El Niño refers to conditions when the sea’s surface in an area along the equator in the central and eastern Pacific Ocean gets warmer than usual. The average water temperature in that area is typically just 1-3°C (about 2-5°F) warmer than normal, but it has the effect of adding huge amounts of heat and moisture to the atmosphere, ultimately affecting patterns of air pressure and rainfall across the Pacific and beyond.
La Niña is the climatological counterpart to El Niño-a yin to its yang, so to speak. La Niña refers to periods when sea-surface temperatures in the equatorial central and eastern Pacific are cooler than normal. The lower surface temperatures suppress transfer of heat and moisture to the atmosphere, again affecting air pressure and precipitation patterns across a large region.
Currently we are in the midst of one of the strongest El Nino cycles since 1950 when NOAA started keeping official records. The graph below charts the Oceanic Nino Index (ONI) which measures temperature variations in the central-eastern pacific. The prevailing El Nino currently measures 2.30 degrees Celsius above average and well above the 2.0 degrees threshold indicating a “very strong” cycle. Based on current oceanic readings it is possible temperatures may rise even further, putting this El Nino in a class by itself.
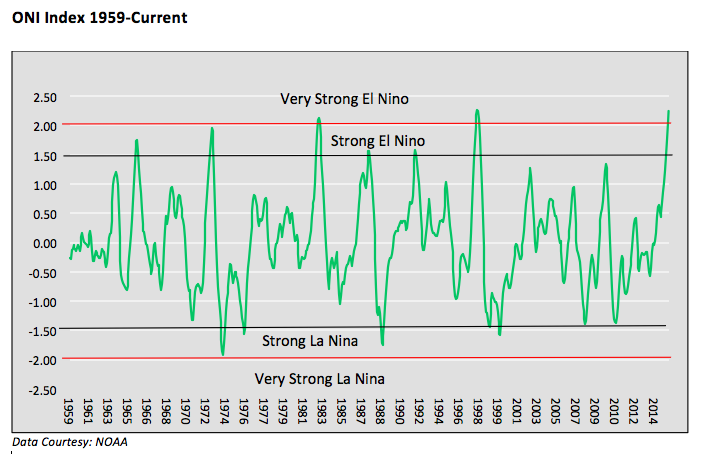
Note: NOAA also publishes a multi-variable index (MEI) measuring El Nino/La Nina strength. In addition to ocean temperature the model accounts for surface wind, sea-level pressure, surface air temperature and cloudiness. Today’s El Nino episode ranks as the third highest on the MEI model since 1950.
NOAA is currently forecasting that El Nino will gradually weaken through the coming spring. It is then expected to normalize and ultimately change to a La Nina over the summer months. A rapid reversal of the cycle is fairly common. As shown above, 5 of the 6 previous “strong” or “very strong” El Nino’s since 1959 have reversed into “weak” La Nina’s at a minimum (less than -.50).
La Nina periods frequently, but certainly not always, result in drought conditions in southern California and below normal rainfall in the central plains. During La Nina periods the northwest tends to be wetter than average and the Caribbean and United States tend to have an increased risk for hurricanes. Most importantly La Nina generally results in higher chances for a warmer and drier than normal summer in the Midwest and Plains states.
La Nina and Crop Prices
As noted above, one of the frequent effects of a transition from El Nino to La Nina is a warmer and drier environment in the Midwest and central plains. Such a weather pattern typically reduces the amount of harvestable corn, wheat and soybeans, the primary crops planted in those areas.
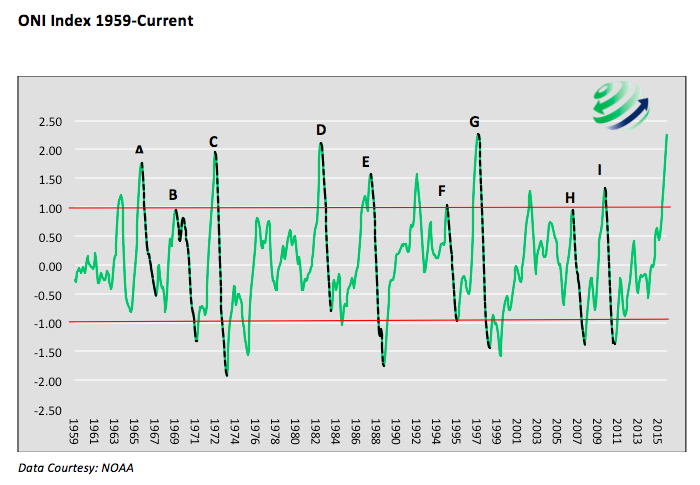
Over 50 years worth of ONI and commodity pricing data were used in this study. Over the period we analyzed there were 9 instances when a NOAA classified “moderate” or “strong” El Nino rapidly flipped to at least a “weak” La Nina. In all of these instances the oceanic temperature from El Nino peak to La Nina trough dropped at least 2 degrees Celsius and averaged a drop 2.83 degrees Celsius.
The graph below highlights these 9 periods with black dotted lines and alphabetical labels. Below the graph lies a table defining each period.
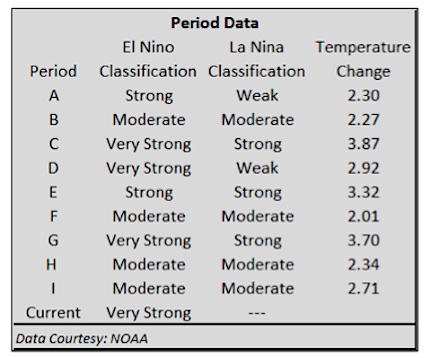
In the following table we evaluate the changes in crop prices that occurred during the El Nino/La Nina transitions.
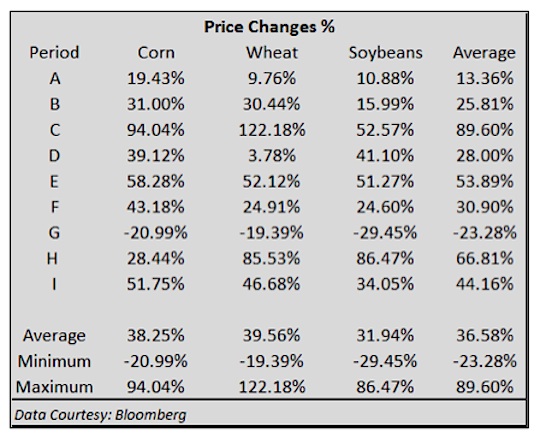
Of the 9 instances since 1965 all but one period, G (1998-1999), coincided with price gains for the 3 crops. It is worth noting however that period G, the only one where the crop prices fell, was the strongest El Nino on record until the current El Nino surpassed it. The other “Very Strong” cases C and D, resulted in respectable subsequent price appreciation.
There are many variables that determine crop output and crop prices in addition to weather. This article, solely focuses on the relationship of historical price changes that occurred during periods where a flip from El Nino to La Nina occurred. We highly stress that price action during these periods were not solely a result of El Nino and La Nina.
continue reading on the next page…


