The commodities sector has seen some real interesting price action of late. While Crude Oil and Precious Metals have been under pressure, the Agricultural Commodities have been holding up pretty well. I took a look at the agricultural commodities a couple weeks ago here. At the time, I was looking for some long term lows to come into play and all were subsequently hit. Some of the price levels were taken out to the down side by a bit but most, if not all, the patterns worked. Yes, it was like catching a falling knife. However, the moves on a weekly/monthly time frame are 1) impressive and 2) important.
So, let’s catch up with the agricultural commodities complex.
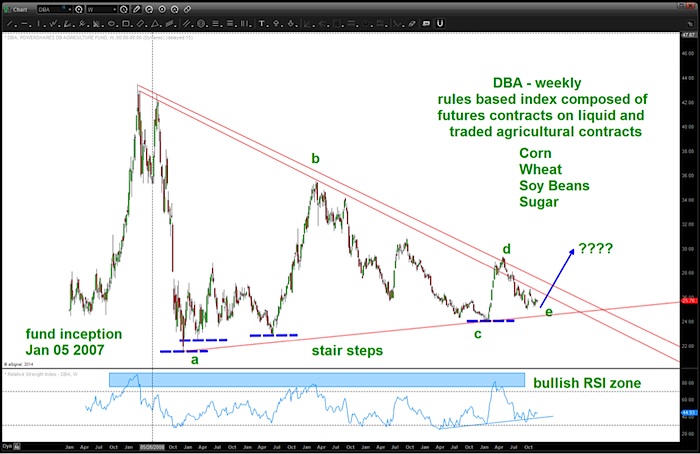
The first chart is PowerShares DB Multi-Sector Commodity Trust Agriculture Fund (DBA). That’s a mouth full so we’ll just call it DBA from here on out. DBA is an ETF that is composed of futures contracts of Corn, Wheat, Soy Beans and Sugar. As I looked at a longer-term chart I decided to draw the “compressing trend lines” and label this as a triangle. Triangles are composed of 5 legs labeled a-b-c-d-e. Also, note the RSI trend ID. The upper resistance area is a “bullish resistance” and the lower end is right in between the bull/bear levels. This is typical of a triangle. Additionally, take note of the “stair steps” denoted by the blue dashed lines. Thus far, a “swing low” has never been broken. The preponderance of evidence suggests an upside breakout from this 6 year triangle.
DBA Agricultural Commodities Sector – Weekly Chart
So, if we are going to resolve this consolidation to the upside, then Corn, Wheat, Beans and Sugar “should” be giving us the same picture. In no particular order, let’s review the agricultural commodities:
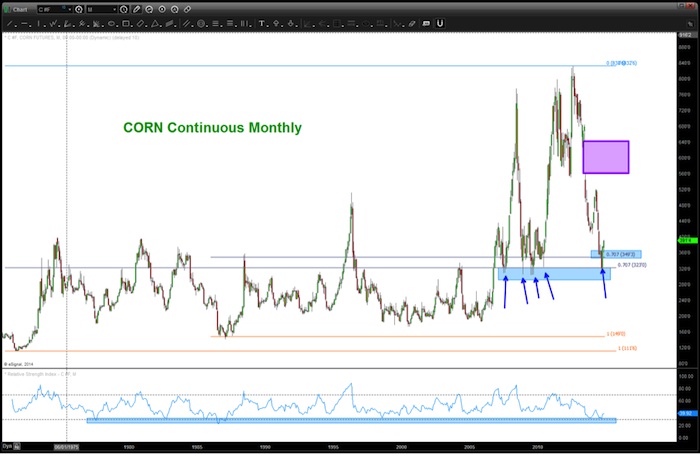
Corn: the 349’3 level was the area I was looking for support. Went thru by a bit and has since put in a monthly bullish signal reversal candle. At a minimum it “should” attack that very large “gap” shown by the purple shaded rectangle:
Corn Continuous Prices – Monthly Chart
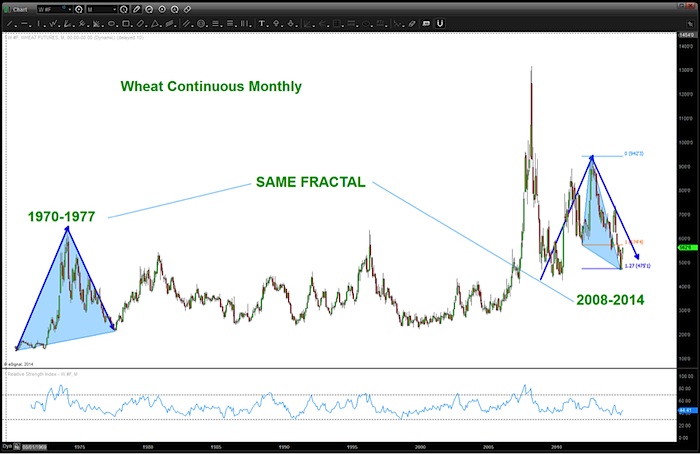
Wheat: If you read the post above, we recognized the same “fractal” present from the 1970-1977 periods. The move UP was exactly the same and we went a little bit below the level shown BUT we did hit a perfect 1.27 extension pattern. Note, the nice thrust out of this area.
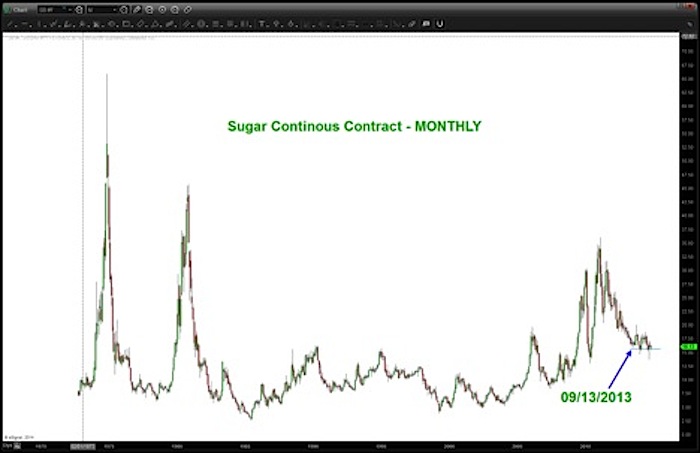
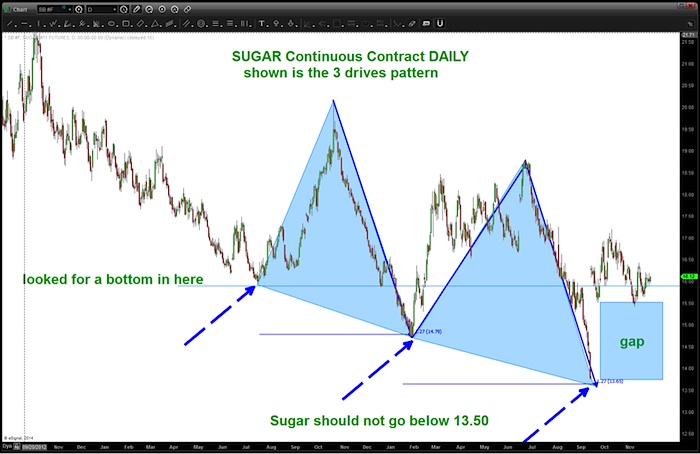
Sugar: As you can see by the chart below, the PATTERN on Sugar was completing back in September 2013. Almost 13 months ago I was looking for this level to hold. Again, it went a little thru the level but has since recovered and, as you can see by the second chart completed an almost perfect 3 drives to a bottom. Click here for a link to my sugar analysis from over a year ago.
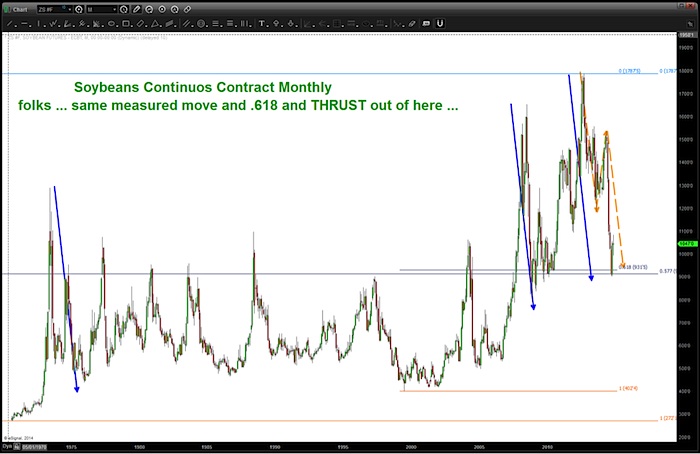
Soybeans: Folks, this is a beauty. Couple things to note:
- MEASURED MOVES on long term charts are amazing. Note the blue arrows …
- LONG TERM Fibonacci nodes are awesome. Also, note the .577 retracement level.
- 3 square root = 1.732 // 1/1.732 = .577
- ORANGE AB=CD into the level.
- CONCLUSION: Soybeans “should” rally from here
Here’s one of my charts showing this level – LONG BEFORE it was hit.

Here’s the result:
So whether you are a Commodities Futures Trader or are simply looking to give a portfolio some commodity exposure, I believe we have identified a nice risk-controlled setup for a “bounce” or renewed “bull trend” in the agricultural commodities. From a risk perspective, I would set stops at weekly closings below any of the lows shown in the charts above, as that would likely render this analysis incorrect.
Have a great Thanksgiving Weekend with family and friends!
Follow Bart on Twitter: @BartsCharts
No position in any of the mentioned securities at the time of publication. Any opinions expressed herein are solely those of the author, and do not in any way represent the views or opinions of any other person or entity.


")


