 During the past couple of months, Apple stock (AAPL) has received a couple of major “long” endorsements from key investors. Bill Miller, Carl Icahn, and now Jim Chanos, have announced they are long AAPL stock. All this excitement has helped Apple’s stock price remain elevated off its April/June double bottom lows. But, in order to really get going, AAPL stock price needs to clear two important overhead resistance levels.
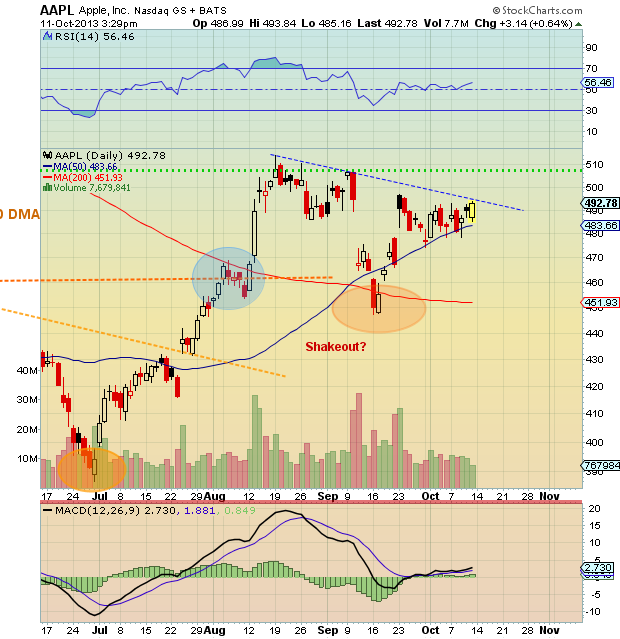
The first level is the short-term downtrend line that has come into play since AAPL catapulted to $513.74 in mid-August; the series of lower highs makes for a nice clean downtrend line. The recent coiling action, though, may be hinting at higher prices. BUT this can only occur with a sustained breakout above the downtrend line.
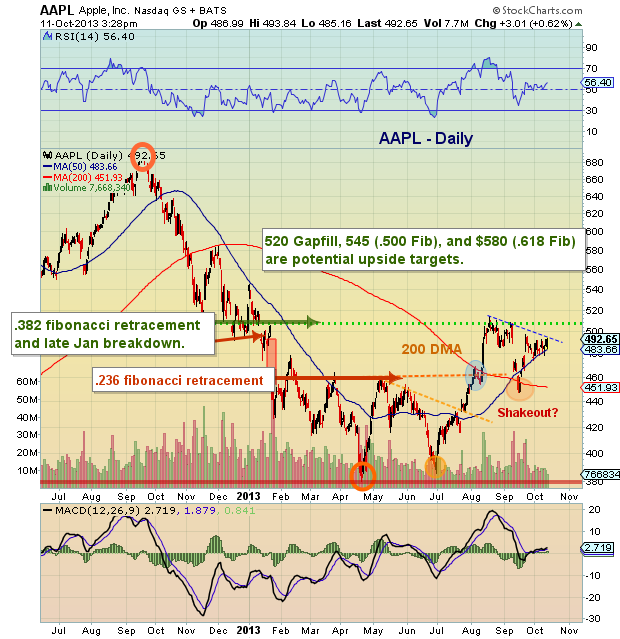
The second level is the 38.2 Fibonacci retracement level of AAPL’s full decline from September 2012’s high ($705.07) to the April 2013 low ($385.10). This level resides at $507.33 and contained the initial burst higher in August (note that the highest closing price was $507.74).
See charts below as reference. Trade safe, trade disciplined.
AAPL Stock – Key Resistance Levels
Macro Chart
“Zoom” chart
Twitter: @andrewnyquist
No position in any of the mentioned securities at the time of publication. Any opinions expressed herein are solely those of the author, and do not in any way represent the views or opinions of any other person or entity.

 Ready To Break Out?")


