 In mid-April, the stock market went into a short pull-back before peaking in late May and returning to April levels. In late June, the market found a summer base to rally from but stalled again by early August. While few made impressive moves during this period, others broke out of weekly bases only to fail to gain traction when the market stumbled once again. Stop and start, but higher we have gone. And that includes select commodities like Crude Oil.
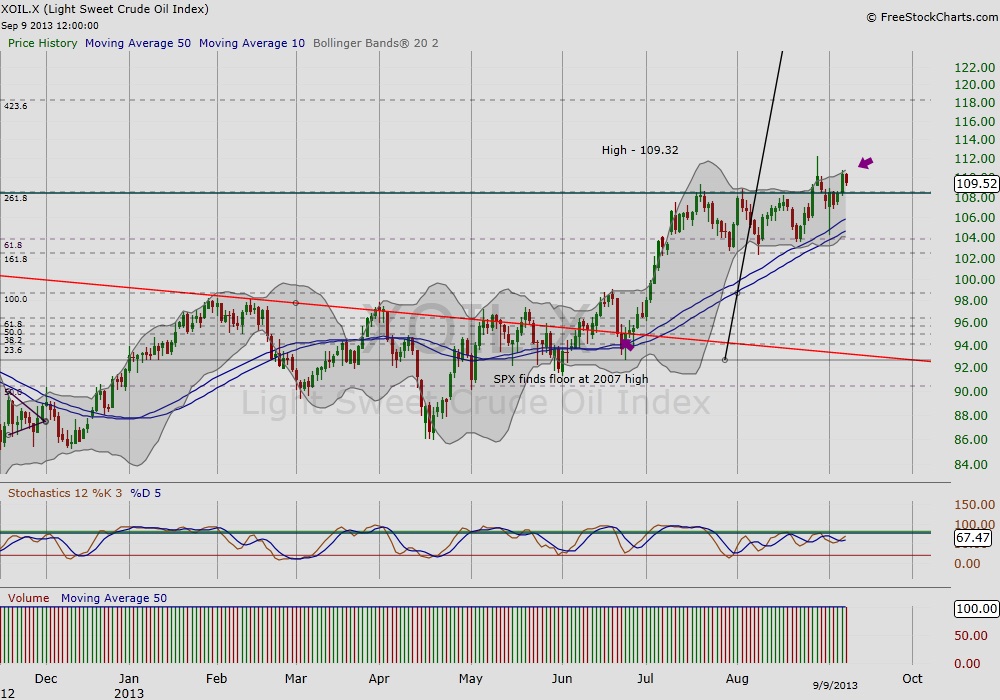
In my latest write-up, I discussed the oil paradox. Therein, I analyzed Crude Oil’s intermarket relationship with equities to gauge where Crude Oil is at in its current cycle.
Today, Light Sweet Crude Oil Index is hovering around previous highs and the S&P 500 (SPX) is just above its 10/50 day moving averages. As the bulls and bears continue to pass the ball back and forth, it is a good time to look for solid bases that may benefit if/when Crude Oil and equities strengthen.
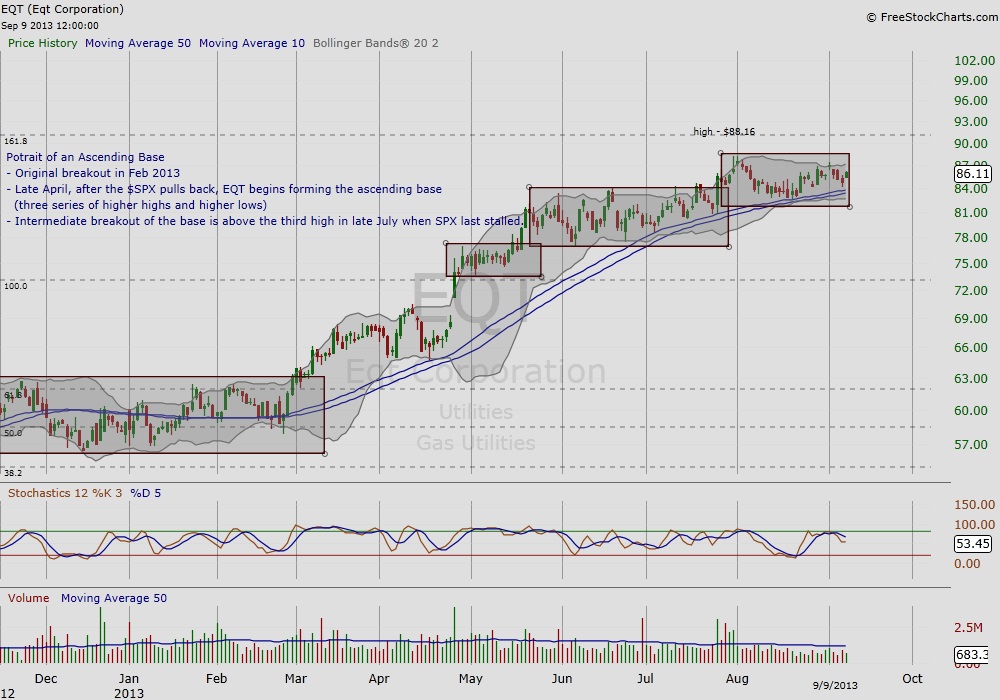
The Ascending Base Chart of EQT Corporation (EQT)
According to IBD University, “(a)n ascending base often forms as the market is working through a correction. It consists of a series of mild price drops — also known as pullbacks — followed by a big breakout.” Moreover, this base forms after a breakout of at least 20% from the previous base. This describes how the base chart of EQT Corporation (EQT) began to build in late April after its original breakout in late February. The ascending base pattern consists of the three consecutive bases with higher highs and higher lows as shown in the three gray boxes. The pattern is interesting for it mirrors the struggles of the SPX after mid-April. What EQT’s chart communicates is a desire to move up, but is clearly waiting for the final green light. EQT has been playing a strategy likened to the game ‘red light, green light’ that first graders play on the playground. Its progress since mid-April has been steady and demonstrates strength in an up/down market. However, it also demonstrates hesitance to take a lead if market sentiment further sours.
FOMC Meeting Considerations
We may continue to see a lack of commitment by the bulls and bears until after the next FOMC meeting scheduled later next week. There have been a few false starts since the market pulled-back in mid-April. The market continued higher in late May, but soon made a deeper pullback returning to April levels. Recently, the SPX fell back below its 10/50 day ma for a second time since last November (since recovered).
Will the next FOMC meeting signal the final green light for the bulls and the end of the five months of relative sideways action. EQT’s ascending base chart demonstrates readiness to make a move if/when the green light comes.
Thanks for reading.
Twitter: @RinehartMaria
References
- IBD University, Chapter 3 Ascending Base found at https://education.investors.com/ibd-university/452143-451713-2-charting-the-course-lesson-3-base-patterns-part-ii.aspx on September 9, 2013.
- Stock charts by FreeStockCharts.com
No position in any of the mentioned securities at the time of publication. Any opinions expressed herein are solely those of the author, and do not in any way represent the views or opinions of any other person or entity.
 Rolling Over At Key Fibonacci Level?")


 Rolling Over At Key Fibonacci Level?")
