The unexpected decision on Thursday by the UK voters to leave the European Union resulted in sharp declines in the major stock market averages on Friday. The S&P 500 Index fell 3.6%, the Dow Jones Industrial Average lost 3.4% and the NASDAQ declined 4.1%. Global stock markets enjoyed a strong rally in front of the vote, which led to greater disappointment and reaction on Britain’s exit from the EU – BREXIT.
The uncertainty surrounding the future course for international trade lead to additional selling and market volatility across global stock markets on Monday.
Nevertheless, stocks entered the new week very oversold and with investor sentiment moving toward panic-like levels. And this backdrop raises the prospects that the 2000 to 2025 area on the S&P 500 Index will lend support.
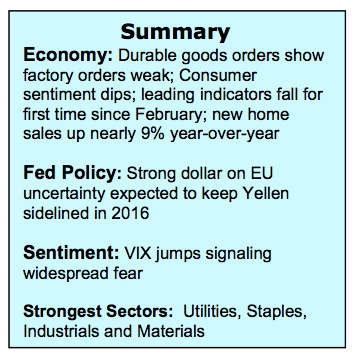
On Wednesday, the European Central Bank will hold a forum in Portugal. Janet Yellen and some of the world’s monetary policy leaders are expected to comment on Brexit and should give investors an idea of how they plan to handle the rising uncertainty in the global economy The bottom line is that the popular stock market averages will enter the second half of the year little changed despite a host of issues ranging from worrisome global economic and political problems to the November election. But with more than $10 trillion of bonds with a negative yield the equity markets have little competition considering 60% of the issues within the S&P 500 Index have a higher yield than the 10-year Treasury note, which finished Friday with a 1.56% yield.
So what should we look for in the technical data this week that would indicate a market low is in place? Here are 5 stock market indicators:
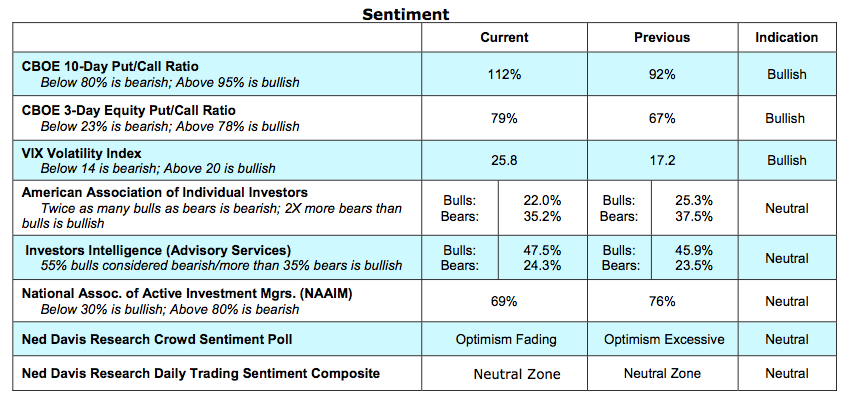
- The TRIN often referred to as the Arms Index, compares advancing and declining stock issues and trading volume as an indicator of overall market sentiment. The TRIN closed on Friday at 2.06. Since 2011, two days above 2.00 has occurred near every stock market bottom. The TRIN symbol on Reuters is .TPIN
- The CBOE Volatility Index (VIX) closed near 26 on Friday. Near the February low this year the VIX reached 28. At the September 2015 low the VIX closed above 40 very briefly. In both cases stocks were at or near cycle lows.
- The 10-day CBOE put/call ratio finished Friday at 112%. Since 2011, a solid market bottom occurred with a reading above 120%. The put/call ratio and the VIX are great stock market indicators to monitor for fear/panic levels.
- In every case since 2011, a market low was near when the American Association of Individual Investors survey showed twice as many bears than bulls. The Investors Intelligence data showed more bears than bulls and the National Association of Active Money Managers allocation to stocks fell under 30%.
- Financial stocks, including the broker/dealer group should not make a new low.
Looking further out, it will be very important that broad stock market indicators remain positive. Currently 65% of the industry groups within the S&P 500 Index are in bullish uptrends. A break below 48% would argue that the weakening trend is more than a short-term event. On the other hand, a rise above 70% would argue another test of the 2015 highs is likely.
Thanks for reading.
Twitter: @WillieDelwiche
Any opinions expressed herein are solely those of the author, and do not in any way represent the views or opinions of any other person or entity.
 Rolling Over At Key Fibonacci Level?")


 Rolling Over At Key Fibonacci Level?")

