 During bull or bear markets, it’s always important to be on the lookout for changes in market behavior. For instance, when market pullbacks are consistently bought at 2 to 4 percent declines, it becomes worrisome when we the markets dip deeper. Or when leaders and momentum stocks get sold and defensive stocks get a bid. These examples are apparent in the current stock market decline and are a representative mix of what I’ve been seeing in my nightly routine of reviewing stock charts.
That said, I thought it would be a good exercise to quickly walk through a few stock charts that provide insights into the current pullback in stocks.
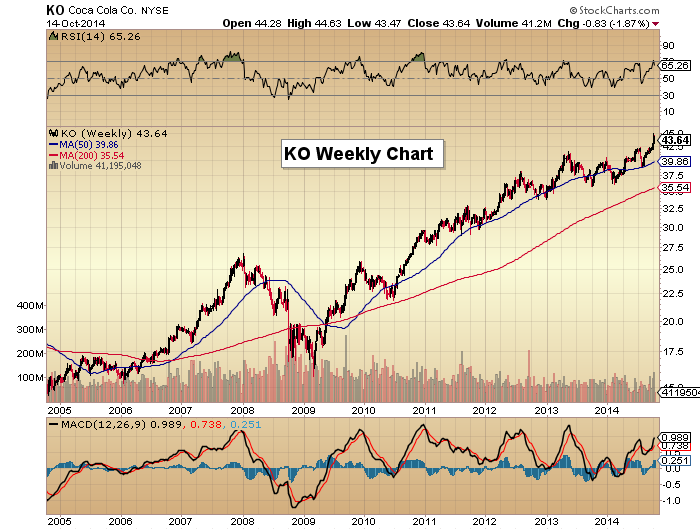
The first chart highlights a consumer staple that has a strong brand and consistent history of slow, steady growth. Yep, sounds like a defensive name. Coca Cola (KO) is a solid name for any long-term portfolio, but when it heads to new all-time highs in the face of serious market headwinds, it says something is going on under the surface. Check out the chart below.
Coca Cola (KO) Weekly Chart
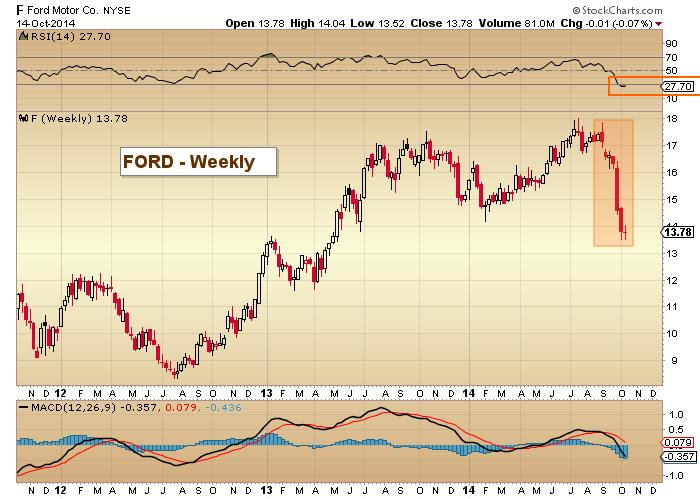
Staying with this note and transitioning to be consumer sensitive stocks like the auto stocks, it deeply concerning when they go in the tank. And General Motors (GM), Toyota Motors (TM) , and Ford (F) have all suffered. Below is a look at Ford’s weekly stock chart. If that didn’t raise an eyebrow than I’m not sure what does.
Ford (F) Weekly Stock Chart
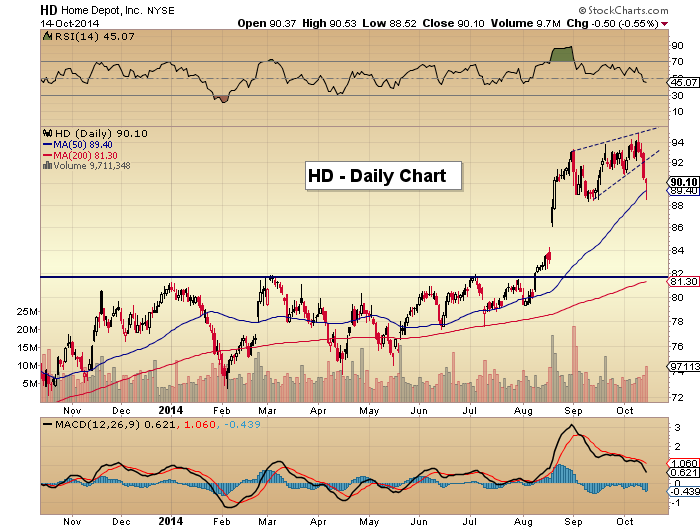
Next, let’s look at look at another consumer sensitive name in Home Depot (HD). Some concerns have resurfaced about housing, but the big box, more heavily/steadily trafficked retailers have held up okay thus far Costco (Cost), Target (TGT), Walmart (WMT). So it’s concerning to see Home Depot slip out of a bearish rising wedge pattern.
But, it was overdue… the RSI divergence was glaring. It’s currently at the 50 day moving average, and bulls will want to see this big box retailer regroup and find its footing. It will also be worthwhile to monitor the big box sector, as the holidays are fast approaching.
Home Depot (HD) Daily Stock Chart
The last two charts that I think are insightful are Tech stocks. Over the past few months, I’ve covered the general market leadership out of Tech stocks. So, when market leading sectors start to falter, it’s a warning sign. As well, when momentum names in said sector get hit, it’s also a caution sign. Also read Robert Lesnicki’s post highlighting the deterioration of Tech stocks back in September. Good stuff.
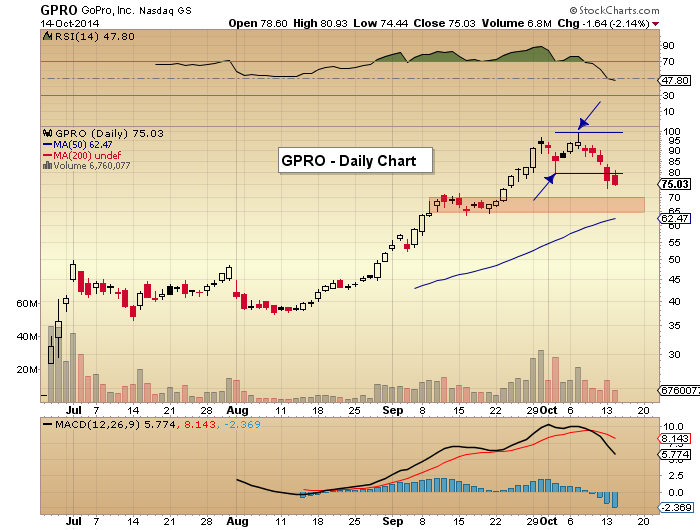
That brings us to beloved IPO name and momentum darling GoPro (GPRO). Last month, James Bartelloni put up some fantastic pattern analysis that pointed to a top around 98 dollars or so. And it was spot on. GoPro’s stock has been hit hard, as have other momentum IPO names like Alibaba (BABA).
GoPro (GPRO) Daily Stock Chart
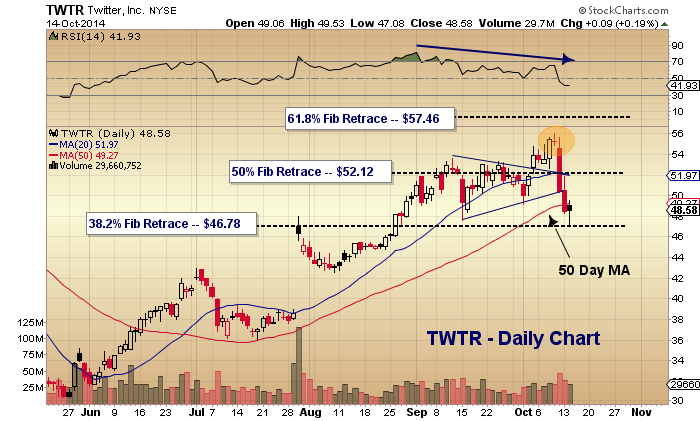
As well, beloved brand and social media stock Twitter (TWTR) has been enjoying a nice rebirth from its summer swoon. But Twitter put on a big head fake around the 61.8 Fibonacci retracement level and created a pendulum reversal (a failed move out of a bullish consolidation pattern that reverses lower). One warning sign was the RSI divergence that saw RSI peak in late August/early September.
This is worth keeping an eye on, but the action is indicative of what can happen to active investors in a market correction.
Twitter (TWTR) Daily Stock Chart
Follow Andrew on Twitter: @andrewnyquist
The author holds a trading position in the S&P 500 (SPY) at the time of publication. Any opinions expressed herein are solely those of the author, and do not in any way represent the views or opinions of any other person or entity.


 Ready To Break Out?")


