 Utilities often isn’t the sexiest sector to invest in, but its days as purely a defensive space or a dividend play are long gone. If you’ve geared your holdings in this bull market to where the best relative strength is compared to the S&P 500 (SPX – Quote), you’re no doubt heavily exposed to technology. Good for you. Now consider managing stock market risk via some exposure to utilities. There are four reasons to do so.
The first is that the sector doesn’t pace the broader stock market as uniformly as its cyclical cousins. Let’s take the example of technology since that has been a hot area this year. The correlation between Technology Select Sector SPDR (XLK) and S&P 500 SPDR (SPY – Quote) since the beginning of the century has stayed above 0.7 a majority of the time, occasionally staying up at a perfect 1.0 (for reference: 1.0 means the two assets are moving exactly in the same direction; 0 indicates no correlation; and -1.0 indicates moving exactly opposite of each other. I compared two assets on a rolling basis over the past 12 months). That’s a very high correlation that means tech is a risky place to be when the broader market falters. Peer cyclicals including consumer discretionary and financials show similar profiles, although to a more modest degree.
In contrast, Utilities Select Sector SPDR (XLU) shows a correlation that has been more variable, ranging from -0.17 to brief periods of as high as 0.83 over the same time frame. Granted, XLU isn’t immune to market downturns. But in a world in which non-correlated assets are hard to find, the lower correlation to the broader market makes it an attractive holding in a portfolio.
Second, the trend and price structure are strong. The image here shows a monthly interval chart on the left and weekly chart on the right. The monthly chart shows how XLU has rallied to record highs in the past three months. That tells us the crowd is willing to buy at higher and higher prices, a good show of confidence in further upside. Now move over to the weekly chart. Look to the midline of Bollinger Bands (a 20-week simple moving average used to define the mean). Absent a few temporary hiccups, this average has risen steadily since 2009 and is at new highs. That points to a strong trend. Additionally, spikes in volume during up weeks since the middle of the year signal accumulation.
XLU Utilities Sector – Monthly & Weekly Charts
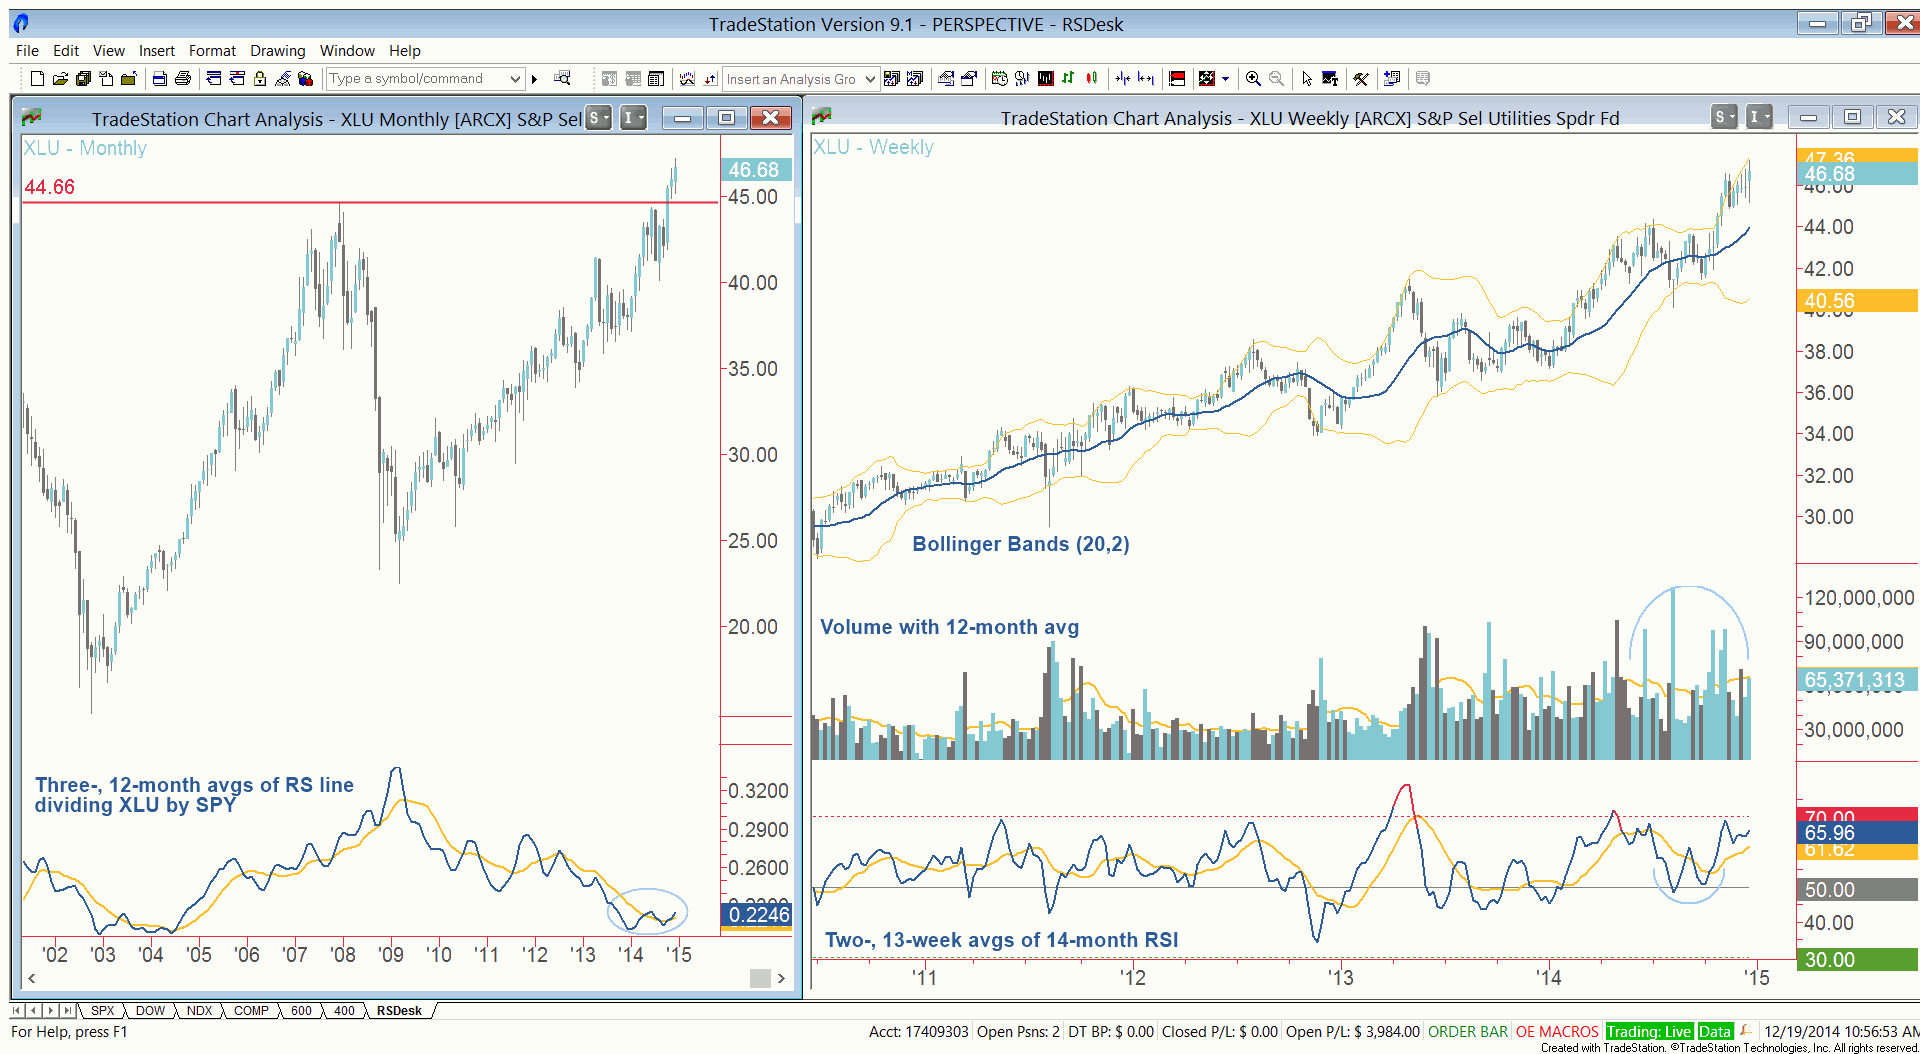
Third, weekly momentum is bullish. The indicator at the bottom of the weekly chart shows fast and slow averages of the default 14-week relative strength index. Note how the fast average put in a sizable double bottom at the midline and went on to break higher. Both the fast and slow averages show rising trends in momentum and neither has reached an overbought reading. That means there isn’t anything technically pointing to buyer exhaustion.
Fourth, a relative strength analysis shows what could be an incipient trend of outperformance to the broader market. Go back to the monthly chart. The indicator shows fast and slow averages of the relative strength line dividing XLU by SPY. Put simply, these averages show trends in how the Utilities Sector is performing relative to SPY. Rising trends indicate outperformance, falling trends the opposite. Indeed, the trend has been plainly down since early 2009. But the fast average put in a higher low this year, and the slow average has turned up for the first time since the middle of 2012. It’s possible that these indicators are bottoming around the same level that they did in 2002-2004.
This piece is as much about adjusting your portfolio in a conservative manner as it is about identifying where the crowd is likely to go next. The S&P 500 had a great run in 2014. That said, throughout the year, the pace of the advance slowed. This often precedes periods of sideways or lower price action, which has me feeling cautious about 2015. All the more reason to take some money out of the hot areas such as technology and gain exposure to areas for which technical conditions are bullish but that are less highly correlated to the broader market.
Follow Chris on Twitter: @ChrisBurbaCMT
No position in any of the mentioned securities at the time of publication. Any opinions expressed herein are solely those of the author, and do not in any way represent the views or opinions of any other person or entity.


