Overview
This is a top-down technical review of the Information Technology (IT) sector, which incorporates relative strength analysis not only to judge the overall health of the IT sector (relative to the S&P 500), but also to help drill down into its sub-sectors to uncover which Information Technology ETFs are in or out of favor. From this, one may benefit by focusing long/short ideas in the relatively strong/weak areas of the IT sector. Note that long and short ideas can be found in bull and bear markets alike at any particular time, but this is an example of my process that I believe allows investors and traders to improve their odds of success over time.
Relative Strength
Relative Strength (RS) analysis pits one competing asset against another and plots the out/under performance on a chart. An upward/downward sloping trend denotes the strength/weakness of one asset (the numerator) over the other (the denominator). This becomes a powerful tool to analyze, however its value is sometimes overlooked. Many of the same tools that a technical analyst uses to evaluate price charts can be used on an RS chart, such as trend and pattern recognition. Two key advantages of this are 1) the ability to position portfolios into asset classes with the strongest RS characteristics and 2) to further fine tune an investment strategy by using the same tool to drill down to the single stock or ETF level to help improve your odds of maximizing wealth and outperforming your benchmark. In other words, it can be used to help portfolio managers and stock pickers alike. The charts that follow provide a brief visual analysis using Relative Strength as its primary device. The RS for the various Information Technology ETFs is plotted vs. the S&P 500 (for Sector) and vs the primary Sector (for sub-sectors). Note that relative strength is plotted as the solid black lines on all of the charts that follow.
Okay let’s turn to the RS charts of 4 major Information Technology ETFs, starting with the big sector ETF.
Vanguard IT Index Fund (VGT) Weekly Chart: Longer-term RS trend still favors IT
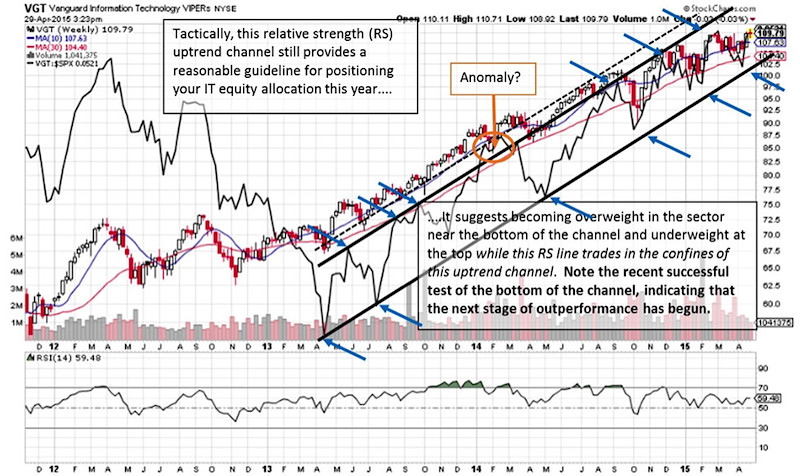
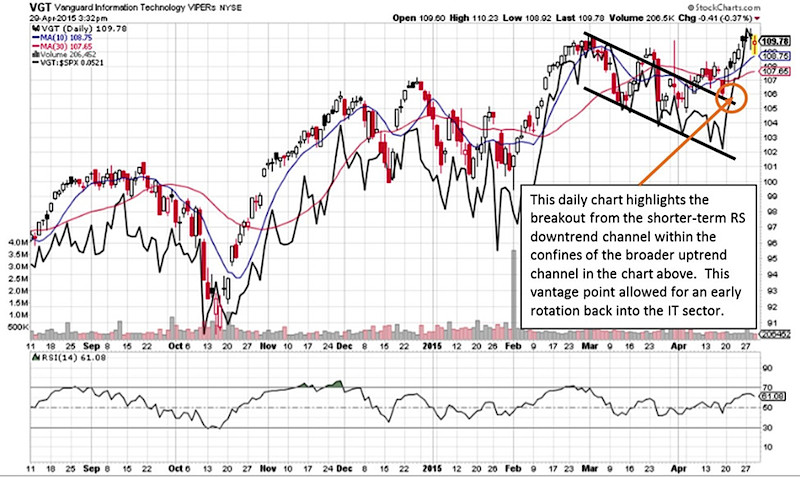
Vanguard IT Index Fund (VGT) Daily Chart: Short-term RS can help tactically position portfolios
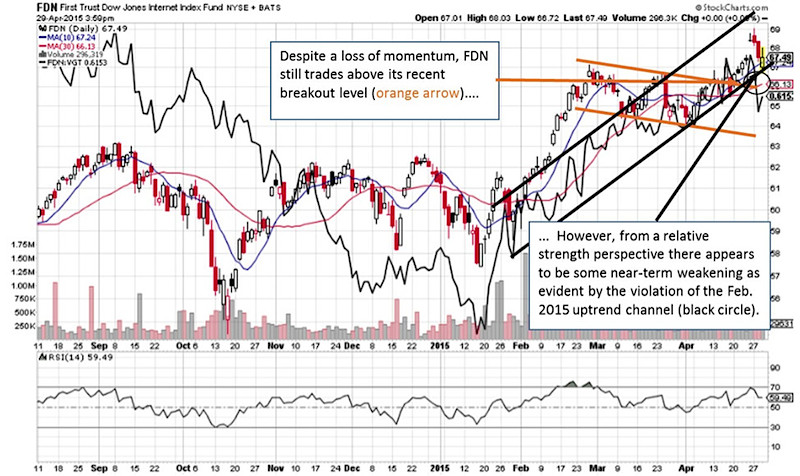
First Trust DJ Internet Index Fund (FDN) Daily Chart: Within the IT sector, this Internet ETF is showing near-term weakness
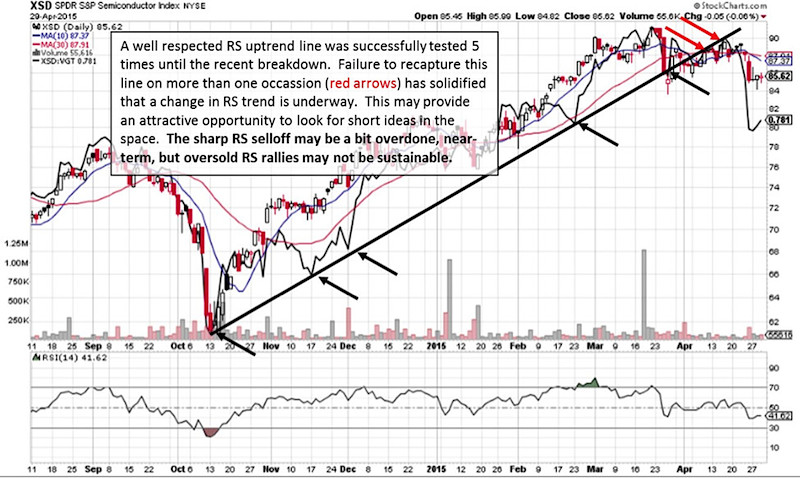
SPDR S&P Semiconductor Index Fund (XSD) Daily Chart: RS trend line breakdown suggests the Oct. 2014 uptrend has ended
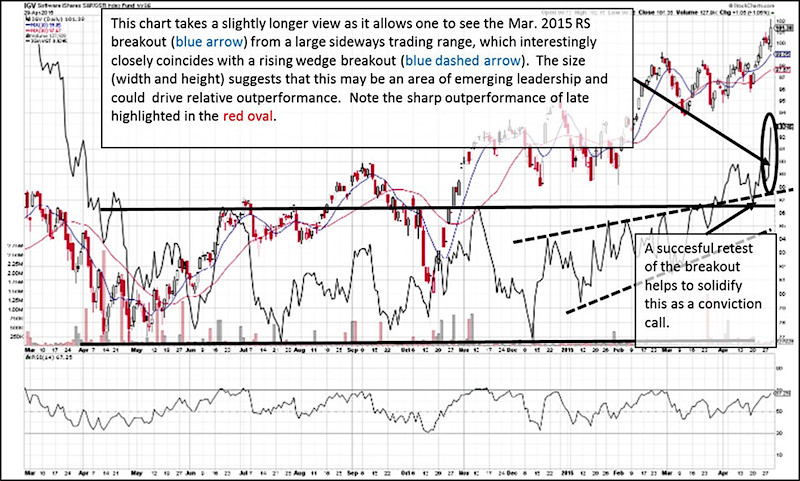
iShares Software Index Fund (IGV) Daily Chart: Large base breakout points to emerging leadership within IT
Conclusion
To conclude, this report demonstrates, in part, my process for uncovering sector strength and weakness by: 1) analyzing sector relative strength leaders/laggards and 2) uncovering subsector relative strength/weakness. From this one could go a step further by 1) choosing stocks within those subsectors that possess correspondingly strong/weak relative strength characteristics, and 2) analyzing the price charts to identify long or short opportunities for potentially profitable trades, while adhering to a disciplined risk management strategy.
As a personal disclosure, I do not own or have a direct financial interest in any security mentioned. Although I am affiliated with T3 Trading Group LLC, opinions reflected are my own and should not be considered as investment advice.
Follow Jonathan on Twitter: @jbeckinvest
Any opinions expressed herein are solely those of the author, and do not in any way represent the views or opinions of any other person or entity.

 Rolling Over At Key Fibonacci Level?")


