It’s been a crazy couple of weeks for Gold prices (and investors).
As most are aware by now, the yellow metal has been out of favor for some time. And more recently, Gold’s slide has turned into a mini-panic. But after diving down into the 1070’s on Friday morning, Gold staged a rally back towards 1100 by the end of the day
The recent action has several of my indicators at or nearing buy signals. Here are a few of them with charts as illustration. Note as well that there is a link to a video study on extreme hurst signals in #4 below.
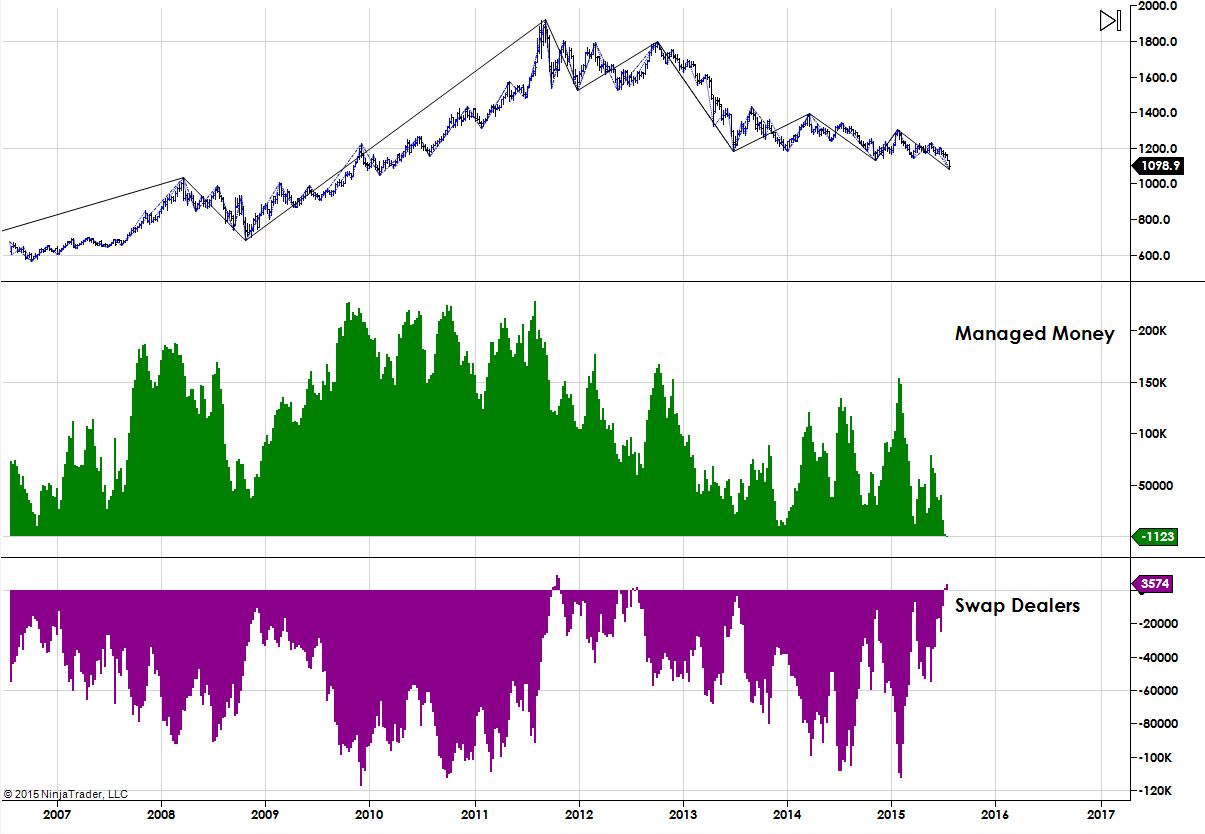
1. Managed Money in COT report just reported first time ever net short position in gold futures!! When there’s no one left to sell…
As well, Swaps have gone net long – a contrarian trade similar to the managed money COT reading. They are selling what people are buying, bets on gold going down)
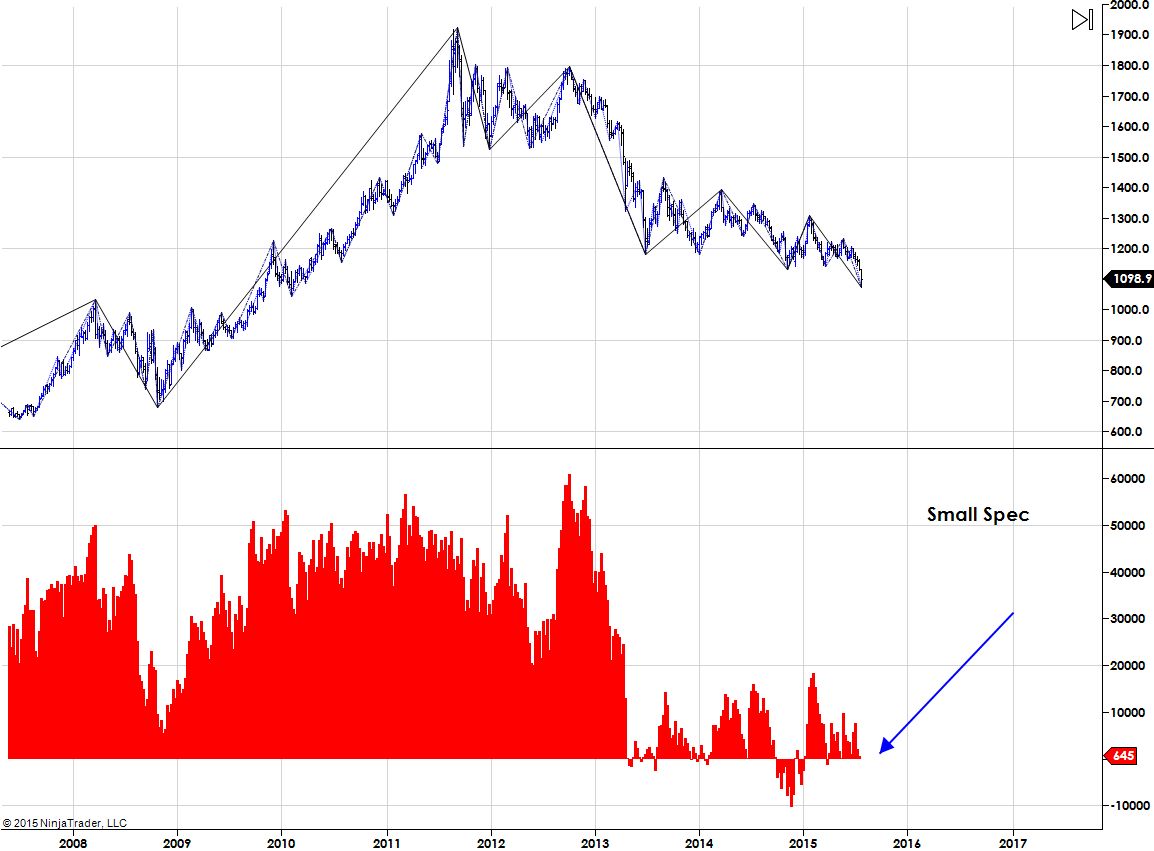
2. Small specs are at very very low readings net short positions. Considered DUMB money, it has shown in the past it pays to fade this group.
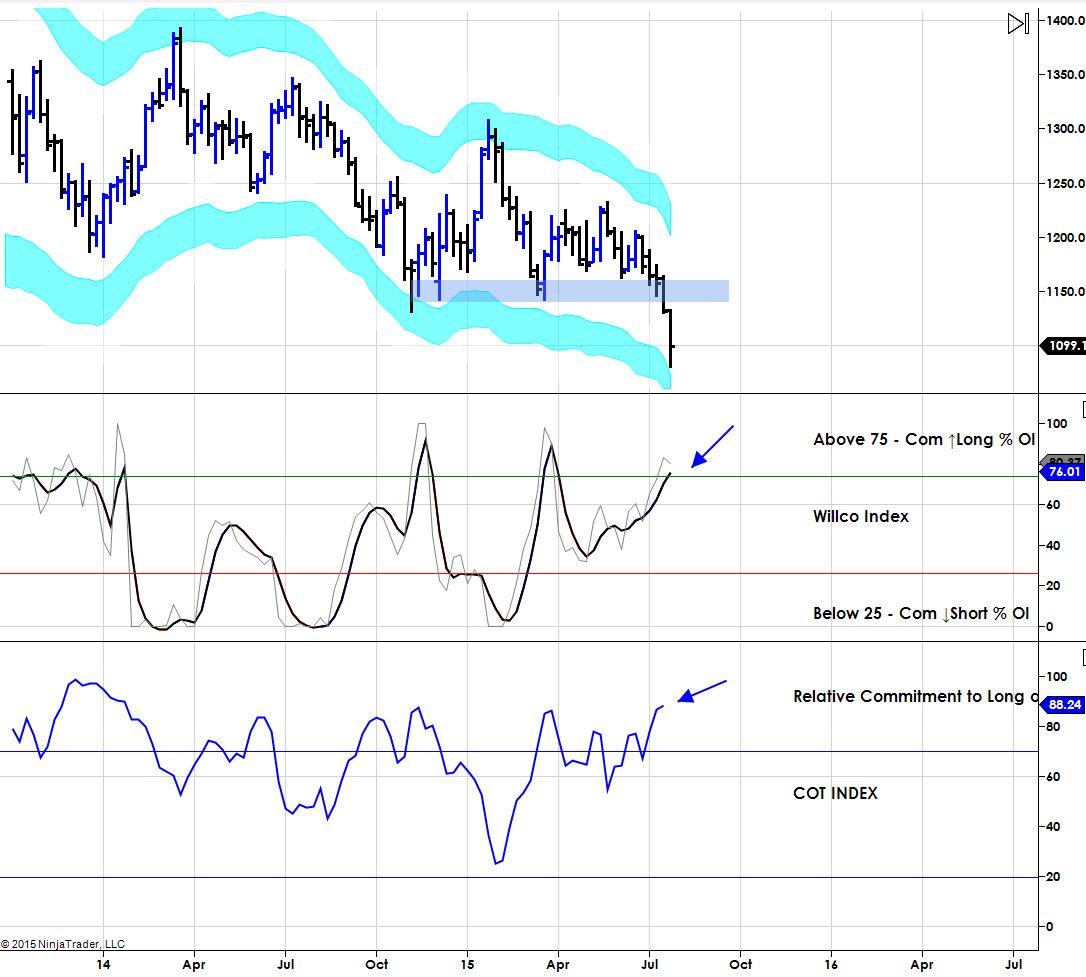
3. The COT Index and WILCO index are at extreme readings – both are formulas that normalize COMMERCIALs behavior relative to themselves over past 1.5 and 3 years.
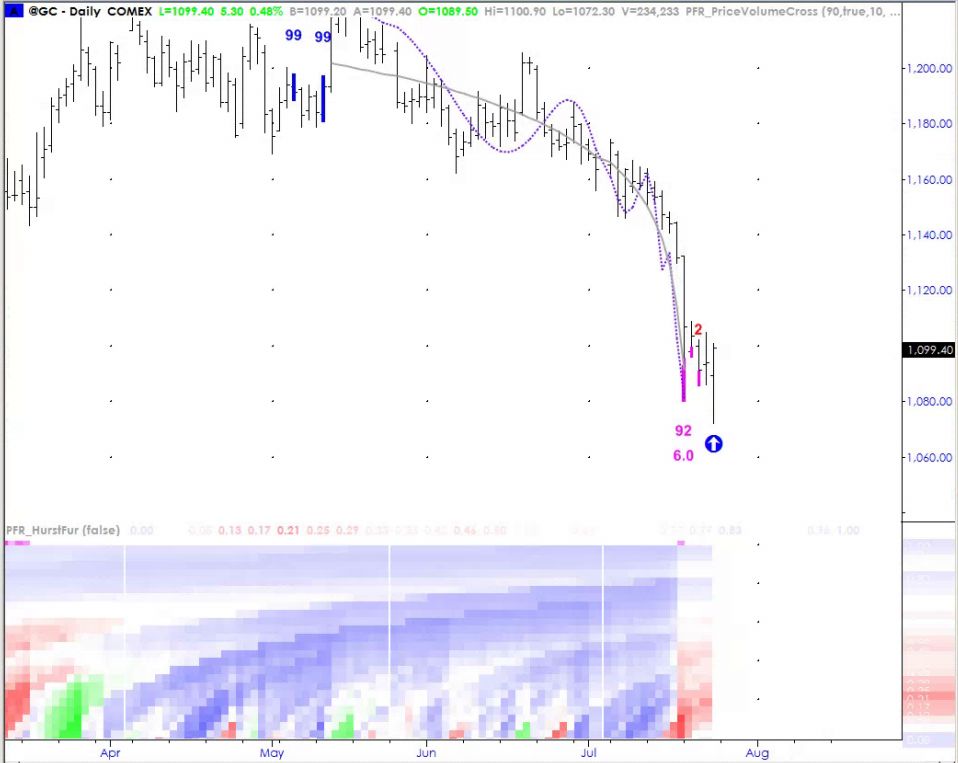
4. We have very high ranking extreme hurst signals on daily scale in gold. This signals markets nearing the end of trends, not necessarily reversal points. Watch a video on this here.
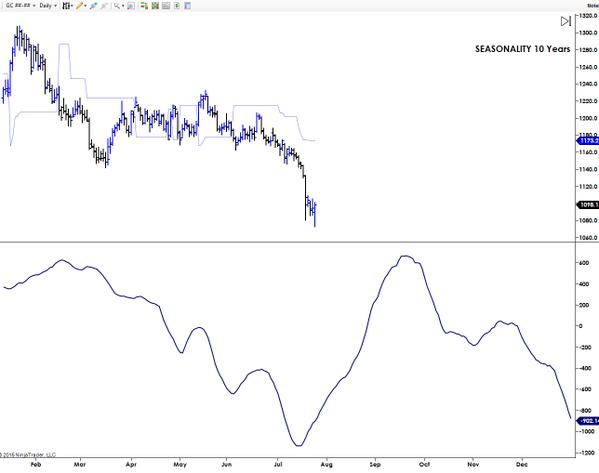
5. Gold’s 10 year seasonality chart is about to turn higher (out of its seasonal swoon).
Thanks for reading.
Twitter: @interestratearb
The author is short Gold put spreads and long Gold futures at the time of publication. Any opinions expressed herein are solely those of the author, and do not in any way represent the views or opinions of any other person or entity.


