As the benchmarks run to fresh highs, individual stocks do not always participate in the same way. Some will join the march higher, some will simply mirror the Index’s advance and of course others will lag and be left behind. This type of action “separates the men from the boys”. What has been occurring on a more frequent basis I have found in 2015 is that an abundance of flag patterns have been materializing. A bullish flag continuation pattern occurs when a stock rises rapidly on a surge in volume (often to new highs) and then stubbornly refuse to let those gains wither away. Flags are continuation patterns, meaning they should break out in the direction of the move, and should optimally be short in duration, no longer than 2-3 weeks. We also like to see volume cool off within the “flag” formation highlighting that investors are reluctant to part with their holdings.
Lets take a look at a few examples that we have profiled in our Game Plans recently and precisely how they were looked at in our report.
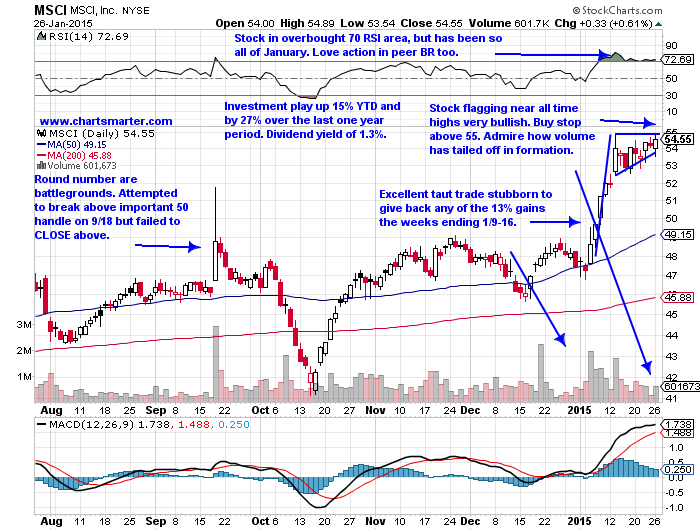
In Tuesday’s 1/27 Game Plan we looked at MSCI, Inc. (MSCI). Looking on the weekly chart one can see just how tight this name traded as the 3 weeks ending between 1/16-1/30 all CLOSED within .40 of each other. This action is even more bullish if it happens at all time highs as it did here with MSCI. It’s now 4% higher than the $55 trigger point to get long and the name looks ready to move toward the round 60 handle.
MSCI assists financial institutions with data and the stock is higher by 15% YTD and by 27% over the last one year period. It also sports a dividend yield of 1.3%. The stock is biding its time just underneath all time highs and digesting a big 2 week gain of 13% the weeks ending 1/9-16 which were accompanied by big volume.
Accumulation has been steadily as MSCI has advanced 10 of the last 14 weeks with all 4 lower weeks in very tame trading. It formed a nice looking flag continuation pattern into late January. MSCI Trigger: $55. Stop $52.70.
MSCI Stock Chart – Flag Formation
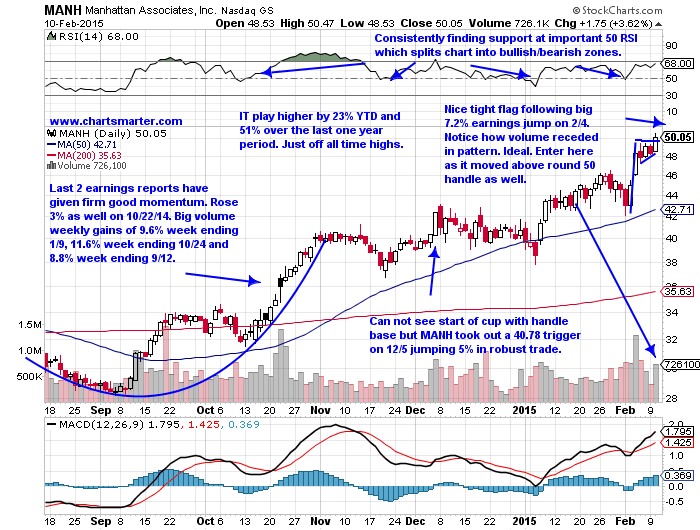
In this Wednesday’s Game Plan we examined the IT play Manhattan Associates Inc. (MANH). The stock was trading very taut after the well received earnings release on 2/4 rising 7.2%. This name was flagging near all time highs too and coincided with the round 50 number, a theory we have an affinity for at ChartSmarter. It is now higher by 3% from the pivot and one should wait for a retest of the $50 area for entry, but this name looks ready for a strong 2015.
MANH is an IT play that is trading just off all time highs and is having a solid 2015 up 23% YTD and 51% over the past year. The stock has nice momentum with 2 consecutive earnings beats higher by 7.2% and 3% on 2/4 and 10/22/14. Volume trends have been excellent since the week ending 9/12’s 8.8% advance with 5 weeks of accumulation versus just one of distribution. The big round number “50” number came into play after it took out a $40.78 cup with handle trigger on 12/5 (jumping 5% in big volume). This looks like a good spot to enter as it not only took out the top of the flag pattern but the round 50 handle as well. MANH Trigger: here. Stop $47.80.
MANH Stock Chart – Ready To Run?
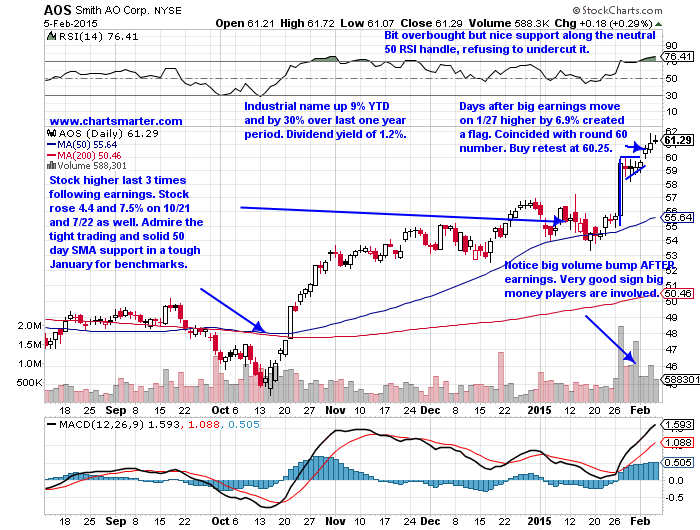
On Friday February 6, we looked at a name that is benefitting from a nice rebound in the housing group: Smith AO Corp. (AOS). It is not a pure play but it’s riding the coattails nonetheless. This is one that never hit our target but demonstrates just how powerful the flag formation can be. Again like the 2 names mentioned above it transpired near all time highs and was significant that it occurred at the round $60 handle. Often they will prove difficult to get through and when they do its a sign of strength. Look for a retest of the round number next week for entry.
AOS is an industrial play that is trading near all time highs up 9% YTD and by 30% over the last one year period and sports a dividend yield of 1.2%. Management is solid as last 3 earnings reports were higher by 6.9, 4.4 and 7.5% on 1/27, 10/21 and 7/22. On the weekly chart one can see how for one year the stock traded in a range between $45-$55 and it took out a $55.28 cup base trigger on 12/22. Volume was unimpressive but the 50 day SMA and action since has been respectable. AOS took out a flag continuation pattern that aligned with the round 60 handle on Tuesday. Entering on a quick retest (pullback) may be the best way to play it. Trigger AOS $60.20. Stop $58.15.
AOS Stock Chart – Continuation out of the “Flag” Pattern
As we look forward to navigating these volatile markets going forward in 2015 look for stocks that make strong price advances and then trade sideways, rejecting the notion of going lower. Bullish flag continuation patterns are usually a good sign of potential good price appreciation ahead.
Follow Douglas on Twitter: @chartsmarter
No position in any of the mentioned securities at the time of publication. Any opinions expressed herein are solely those of the author, and do not in any way represent the views or opinions of any other person or entity.

 Rolling Over At Key Fibonacci Level?")


 Rolling Over At Key Fibonacci Level?")