The 3 highlighted paragraphs below were sent out to subscribers right after the market close on Thursday. Little did I know just how powerful it was. While I have been calling for a stock market pullback the past couple of weeks, which would set the stock market up for new highs, I did not see the train wreck on Friday even though my targets for the pullback were still below Friday’s close.
Predicting a big event based on prior price action is a fools game. The stock market had been rallying into the news and the bulls were once again pounding their chests.
The best analogy to the recent stock market action is a strong biotech stock going into trial results. Your best flipping a coin here, as few know these outcomes.
To some, the only thing that matters is the vote: Will they stay or will they go? Once we have the answer to that, it becomes: When will the Federal Reserve pull the trigger on interest rates? When we have the answer to that: How bad or good will second quarter EPS reports be? When we get that answer: Well you get the picture.
These are all unanswerable questions and yet thousands try to do the impossible. Think of the hours spent analyzing this vote (I refuse to use that #B word). And I’m not talking about stay or go, but the implications of an exit. The man-hours and brain power spent is mind blowing. The phone conversations, the spreadsheets, the meetings, the reading, the analyzing, the arguing, the polls, the handicappers, etc.
The economists weigh in, the portfolio managers take their turn, the international strategists weigh in, etc. And don’t get me started on the media. OMG! Non-stop coverage of all this nonsense. It’s a producer’s wet dream.
I also sent this to subscribers about 1:30 A.M. Friday morning and is still relevant:
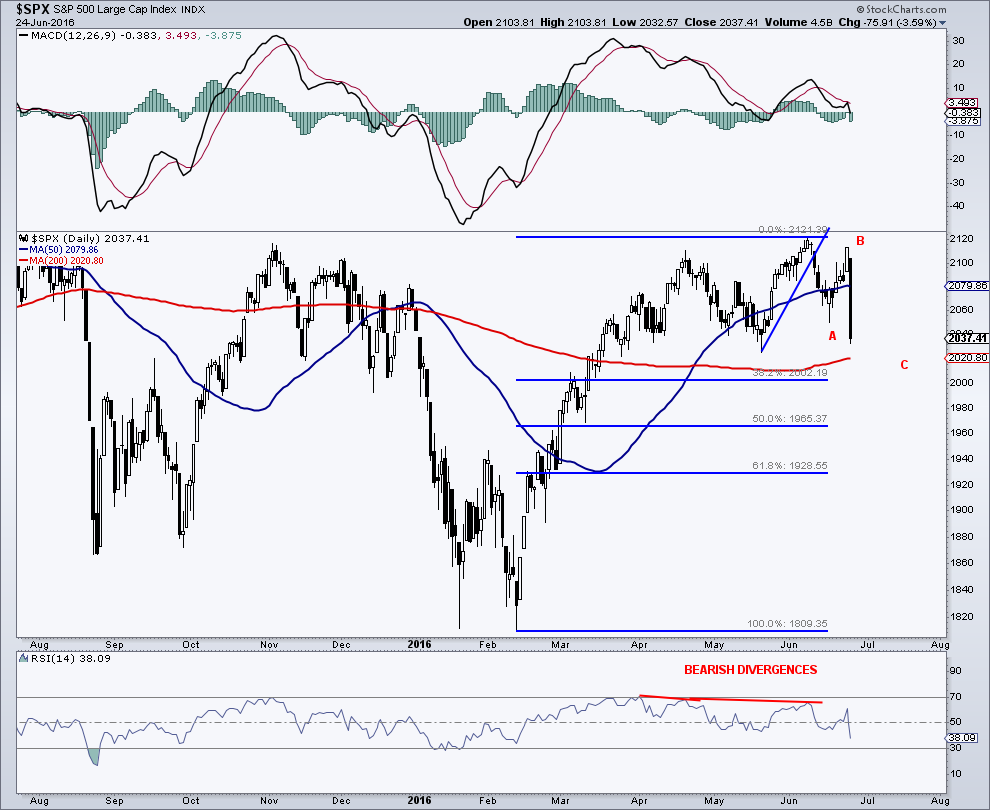
S&P 500 futures are currently limit (-5%) down 107 points at 1,999 implying an open near the 2007 level for the cash market. I used this chart in last week’s (6/18) update showing the possible 3-wave (ABC) decline. A 38.2% retracement of the rally since February targets 2,002 on the S&P cash. The 200-day is at 2,020.
For wave C, a typical move would be 1.618x of wave A (70 points). So 70 x 1.618 equals 113 measured from the top of wave B. Giving us a target of 2,000. The cluster of potential support near 2,000 is certainly interesting, but this is a bit early to say the least with the after hours volatility.
S&P 500 Chart (through Friday) w/ June stock market pullback levels:
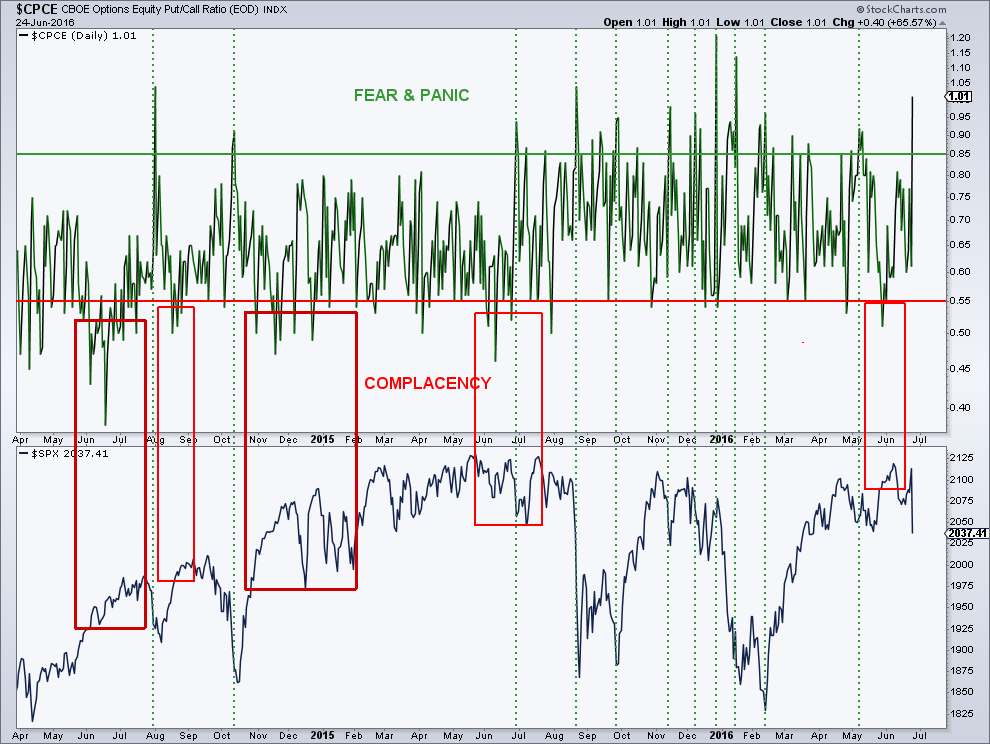
The great thing about rapid price moves lower is that they have a way of quickly reversing market sentiment. The chart below (Daily CBOE Equity-Only Put/Call Ratio) illustrates the incredible swings in this ratio going back to the summer of 2014. Sometimes when the put/call ratio moved into fear and complacency zones, they represented great buy/sell signals. Sometimes they did not. No stock market indicator works all the time. Check out all the high (fear) and low (complacent) readings seen in November and December before the market tanked. I think some of the issue of confusion here can be the lighter options volume during the holiday, allowing wide swings on relatively small price moves.
There was a nice spike Friday into the fear and panic area. Certainly, an expected response to the price action here and abroad. While the down move from the recent high is in “unfinished business territory,” this put/call spike is certainly a feather in the bull’s hat.
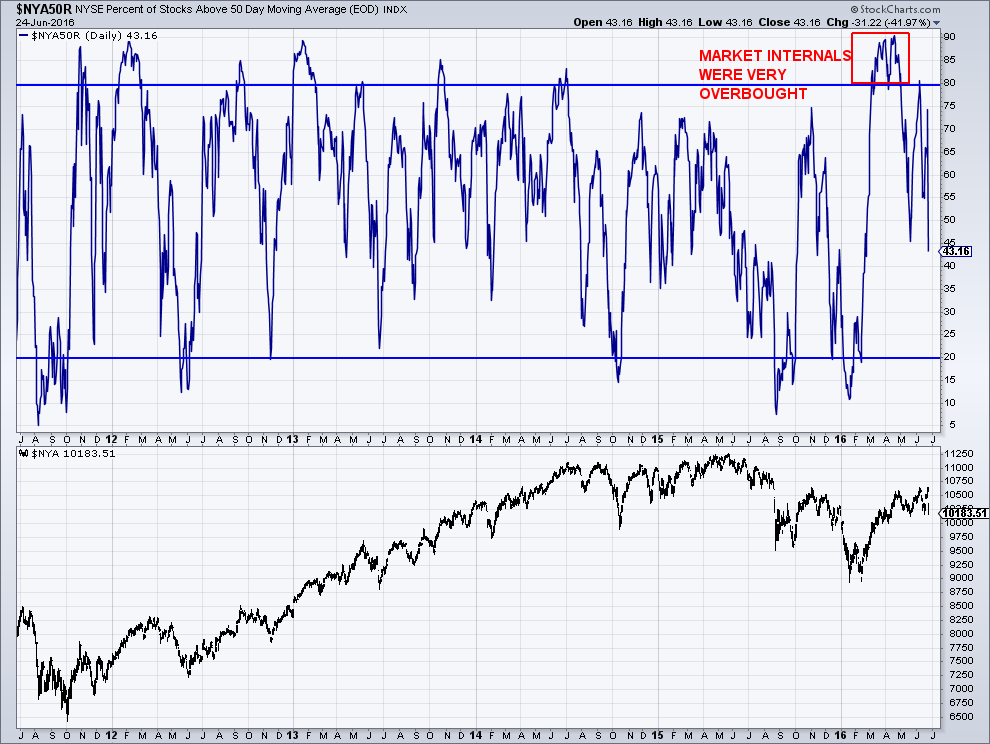
Hey, market internals were very overbought. Investors generally want to see a stock market pullback when these conditions present themselves (and the market needs it).
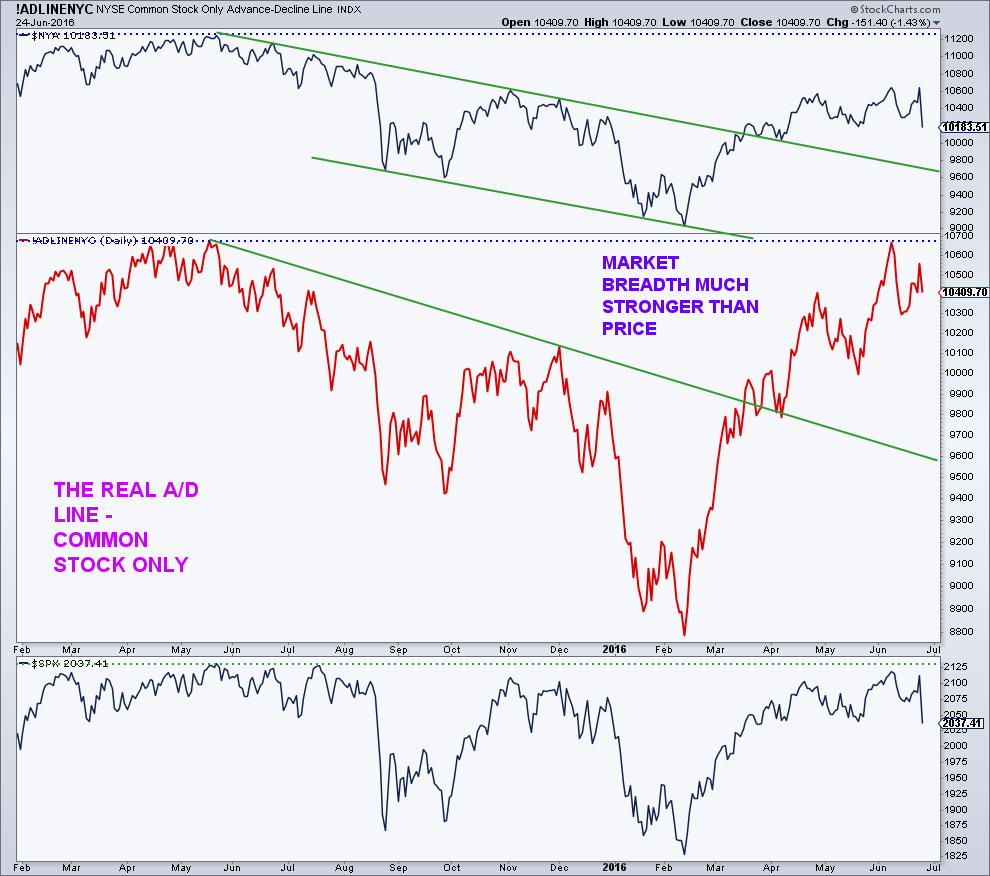
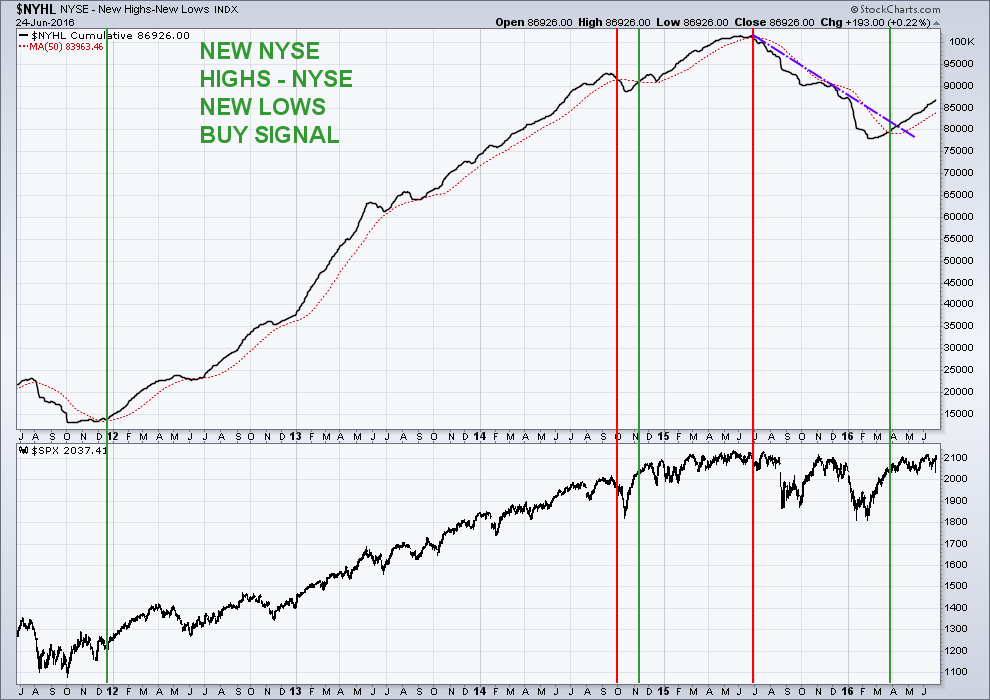
I don’t think you can argue with NYSE market breadth, though. This still suggests new highs for stocks down the road.
And this: These buy signals “tend” to have staying power historically. Not always though.
I am using each Fibonacci (FIBO) retrace starting with 38.2% (2,002) to layer in (i.e. take long positions). A 50% retrace targets 1,965 with a 61.8% giveback down at 1,929. Additionally, it’s likely if this pullback exceeds 7%/8%, that there will be some price structure to the eventual bottom such as a double bottom or inverse head-and-shoulders bottom. V bottoms after decent declines are very rare.
Thanks for reading and best of luck out there. You can contact me at arbetermark@gmail.com for premium newsletter inquiries.
More from Mark: Market Pullback May Set Up Big Rally
Twitter: @MarkArbeter
The author may have positions in mentioned securities at the time of publication. Any opinions expressed herein are solely those of the author, and do not in any way represent the views or opinions of any other person or entity.


