What a year! And it’s only the beginning of May. Over the past couple of months, if you have been participating in the reversion to the mean trade, its been the best market in sometime. If, on the other hand, you have been loaded up with some of the bull market favorites, mostly from technology and biotech land, you’ve either been stuck in mud or got had your face ripped off.
Some one once said, there is always a bull market somewhere. Maybe he should have added, there is always a bear market somewhere. Sector selection has certainly been key in recent months.
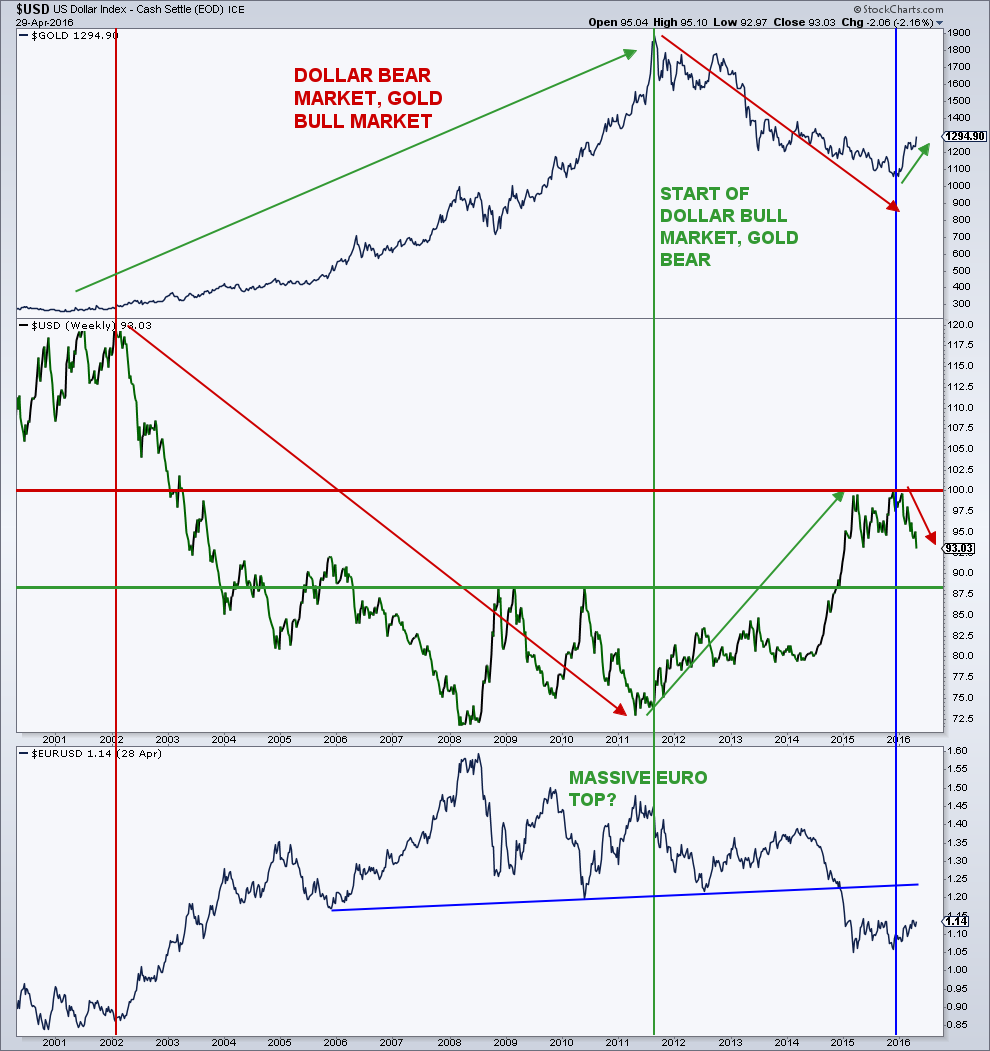
The following weekly chart goes back about 16 years and shows the clear intermarket relationships between the US Dollar Index (USD), Gold (GLD), and the Euro. Quite simply, greenback down, gold up, Euro up. And of course, this works in reverse: USD up, gold down, Euro down. For now, the focus is on the current US dollar decline.
The long bull market in gold was fueled by the bear market in our currency. In my opinion, the only reason to own gold is to hedge or protect against currency weakness or loss in purchasing power. Of late, you can see that the recent weakness in the greenback has led to a nice rally in gold, but that’s not the whole story. Crude oil, other metals, steel, industrials have all benefited from the eroding dollar in 2016. In many cases, we have witnessed extraordinary moves in companies within these industries.
Some of this has been the US dollar decline, some of this has been due to short covering, some of this to an underinvestment by institutions, and some to clear washouts (mega bear markets) in these industries.
So, will this reversion to the mean trade continue to offer investors even more outsized gains?
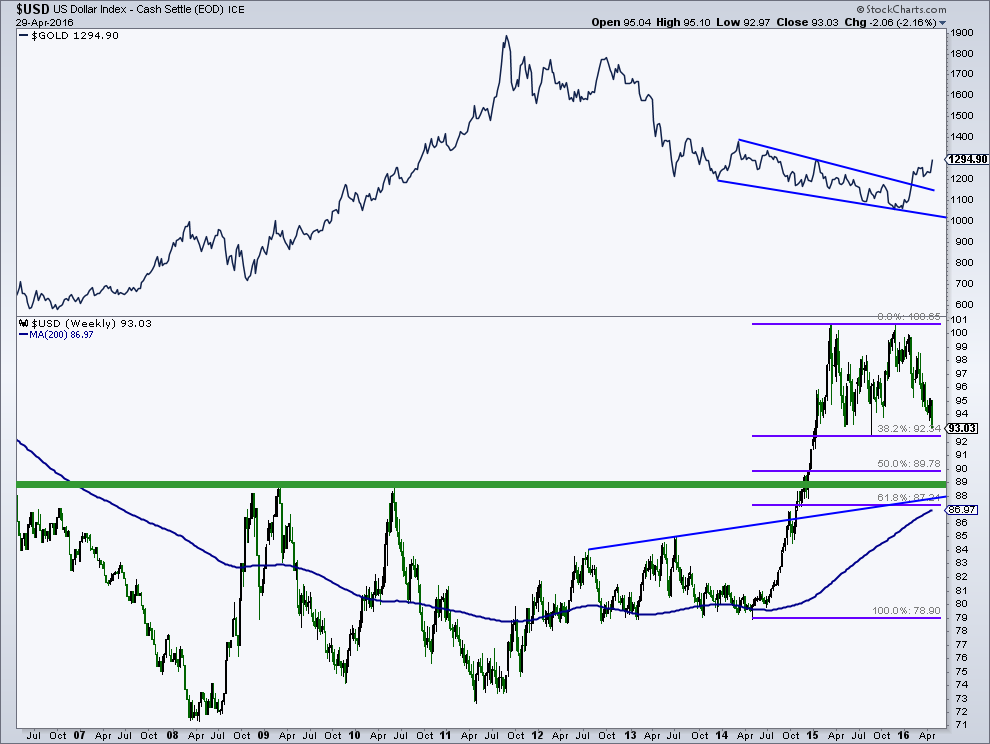
For that answer, keep an eye on Mr. Greenback. The US Dollar is sitting on the bottom of it’s trading range with key chart and Fibonacci support in the 92.50 to 93 region. A break of the this support along with downside follow through will be like throwing gasoline on the above mentioned sizzling industries. Based on the size of the trading range, FIBO targets, the 200-week average, and chart and trendline support, the US Dollar decline could extend down to the 86 – 89 area.
Sentiment as well as Commitment of Trader’s (COT) data suggests that there is more downside for the dollar. Sentiment has not yet cycled into extreme pessimism for US Dollar as it remains higher than it was back when the greenback last bottomed in the first half of 2014. The COT data is showing that commercial trader’s (smart money) have been increasing their net futures positions in the dollar since March 2015, but have not yet gone net positive on the dollar like they did in early 2014. Sentiment and COT data for the Euro are basically opposite the USD.
So keep an eye on the greenback and the industries mentioned as the fireworks may continue.
Thanks for reading and have a great week. You can contact me at arbetermark@gmail.com for premium newsletter inquiries.
More from Mark: Energy Sector Looks Higher Once More
Twitter: @MarkArbeter
The author does not have a position in the mentioned securities at the time of publication. Any opinions expressed herein are solely those of the author, and do not in any way represent the views or opinions of any other person or entity.


 Ready To Break Out?")

 Ready To Break Out?")

