The presence of flat 200 day moving averages throughout many of the US Stock Market Indices and sectors, combined with a few other factors, is causing me to maintain a neutral / bearish stance toward equities for the time being. Luckily, as a technician I can take advantage of opportunities in other non-correlated liquid assets.
That being said, the Global X Uranium ETF (URA) looks good on the long side for a number of reasons.
Here are a few:
- The Uranium ETF (URA), despite being an equity ETF, has no correlation to the S&P 500 over the past month, quarter, and year. This is great given my view on equities at the moment.
- My structural downside price targets for the Uranium ETF have been met while momentum diverged positively on multiple timeframes, suggesting we may be due for some mean reversion.
- The risk/reward ratio is high and the risk is well defined.
Overall this backdrop has the characteristics I look for in this type of environment, and given the lack of interest / buzz around this particular space, I think a sharp rally can develop if price action continues to improve.
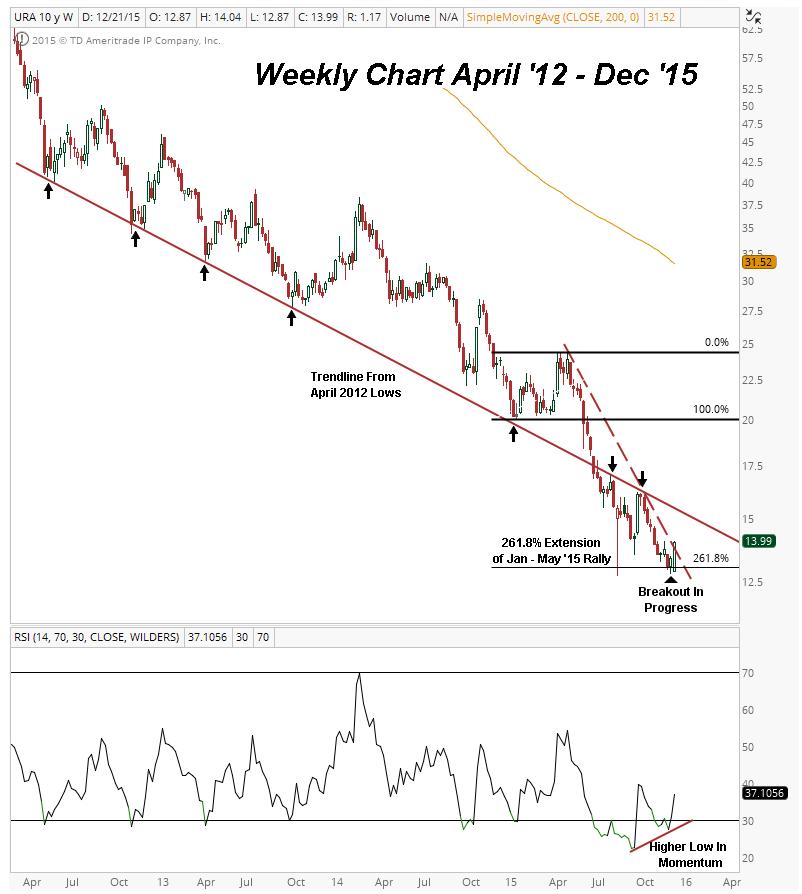
From a structural perspective, there have been few things worse than URA these past few years. It is down roughly 90% off of its 2011 highs and needs to reverse split occasionally just to remain trading. With that being said, my structural downside target at the 261.8% extension of the January – May 2015 rally was met this past August. More recently, the Uranium ETF retested the year-to-date lows, momentum diverged positively, and prices are now attempting a breakout above the accelerated downtrend line that’s been intact since May.
If this breakout holds, the next big hurdle is the trendline from the April 2012 lows near 15.50, but that’s still over 10% away from current levels.
Uranium ETF (URA) Weekly Chart
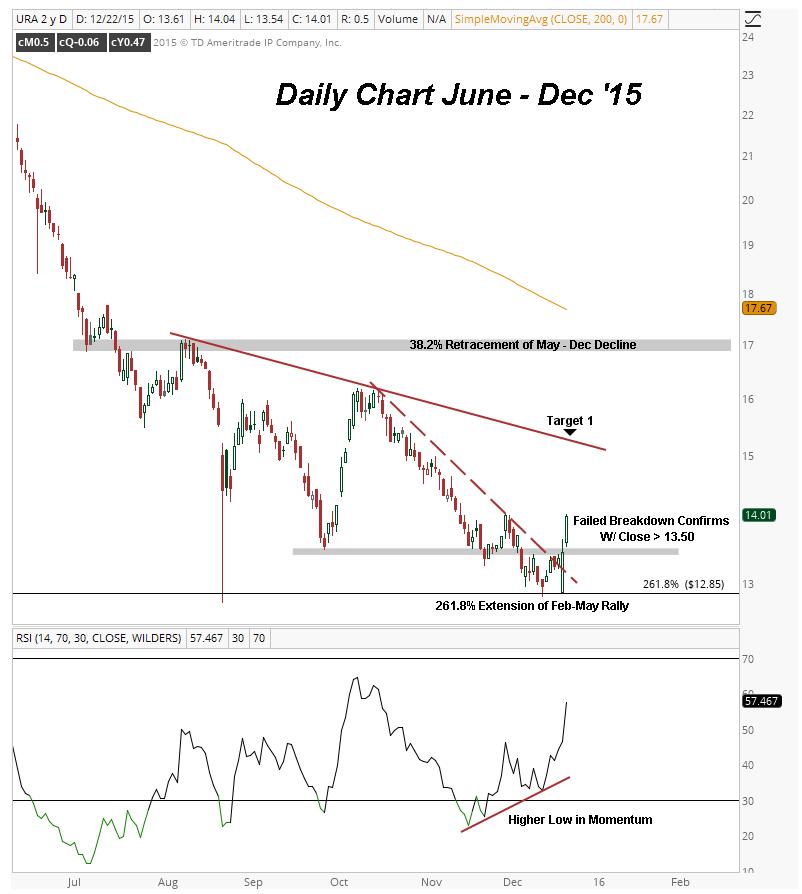
The daily chart for URA provides a closer look at the retest of the year-to-date lows with momentum diverging positively. After a few weeks of basing, prices have finally broken out above the prior low near 13.50, as well as the downtrend line from the October highs. If this breakout can hold, the first target seems obvious at the downtrend line from the August highs near 15.25, which corresponds nicely with the longer term downtrend line on the weekly chart. Above that, there is prior support near 17, which also represents the 38.2% retracement of the May-December decline and the area of the downward sloping 200 day moving average. That is the ultimate price target for the Uranium ETF if the rally continues to develop over the next few weeks and months.
Uranium ETF (URA) Daily Chart
continue to next page for more on relative performance and price targets…


