 The U.S. Equities market has not seen a correction of at least 10 percent or more since 2012. Today, the market is once again demonstrating weakness given numerous distribution days and heavy selling. However, we’ve been here before only to see the stock market dust itself off as a new rotation gets underway and cyclical sector performance refreshes anew.
And once again, the S&P 500 (SPX) has reversed higher off the bottom of its trend channel (traveled since the fall of 2012). Needless to say, it has become an exercise in futility to say whether now is the time for a full-on correction. Instead, let’s look at past and present sector performance charts to gauge where the market is likely to head next.
Perfcharts provide a useful and objective tool to tell the story of where the market has been, and where it may be headed. Especially when breaking out the market by sector performance. Last November, Perfcharts told us that Materials (XLB) and Industrials (XLI) were gaining momentum, and indicated that it was time to look again at Energy. Today, we can see from the Perfchart below that Utilities (XLU) and Energy (XLE) have been the leaders for much of 2014. Utilities and Energy are generally viewed as defensive sectors, as they are less dependent on the health of the consumer, who may go without a new shirt or car but will make efforts to pay their electricity/heating bill.
S&P 500 Sector Performance Chart – 2014
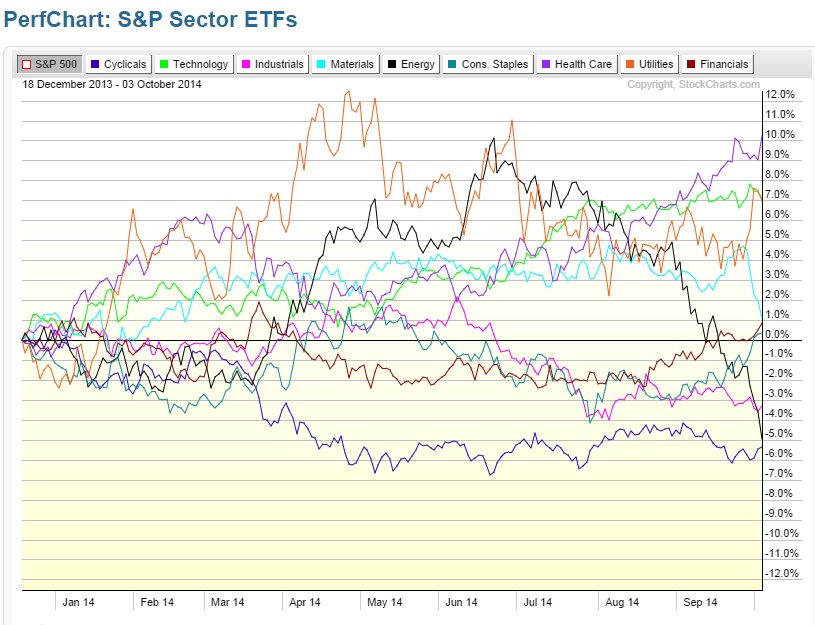
Charts from StockCharts.com
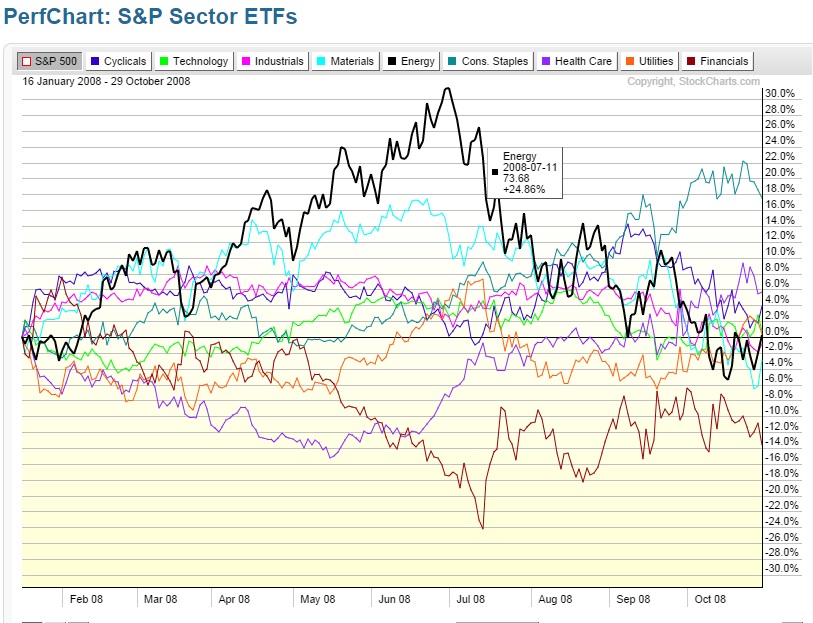
In previous cycles, the peak of Energy and Utilities served as a warning sign for the general market. This was the case in 2008, as shown in the chart below. In line with previous cycles, Oil peaked in the summer of 2008 and lead the markets lower thereafter. Of course, the 2008 bear market was not your typical market slow-down; it coincided with the financial meltdown, which evolved into the Great Recession. Since then, we’ve seen less severe market corrections in the summer of 2011 and 2012.
What we have not seen in recent market cycles is a run-up in wages that often leads to a run-up in spending before an inevitable peak. Instead, the current recovery has been slow-going for the consumer. Note in the chart above that Cyclicals have been the undisputed laggard as far as sector performance in 2014. This shows that the employment numbers aren’t quite as rosy as they seem.
That said, sector rotation can sneak up on you so try not to get too bogged down in the past. The basics of cyclical sector rotation tell us that the market as an aggregate is forward looking. And with this in mind, it is worth noting that the Financial Sector (XLF) and select cyclicals tend to improve even as the overall economy continues to slow. And for this reason, they could soon emerge as deals.
S&P 500 Sector Performance Chart – Feb 2008 – Oct 2008
The Take Away
The market is under selling pressure again. Over the past two years, we’ve seen the market bounce back as equities approach the lower end of a two-year channel. However, one look at sector performance for 2014, and its clear that the rise and fall of Utilities and Energy is a cautionary flag telling investors to wait for follow through.
Despite a more positive tone out of the employment numbers, the market is still coming to grips with risk exposure. Part of the lack of enthusiasm is likely due to the reality that wage growth is still lagging. Typically, stronger employment leads to increased spending. Ironically, those market sectors that warn us early that the economy on the ground will be slowing tend to turn up when the economy on the ground finally slows down. Encouraging signs of improvement coming from the financials and cyclicals may be pointing to the market’s anticipation of a stronger consumer (and perhaps wage growth). Thanks for reading.
Follow Maria on Twitter: @rinehartmaria
No position in any of the mentioned securities at the time of publication. Any opinions expressed herein are solely those of the author, and do not in any way represent the views or opinions of any other person or entity.


